Dashboard¶
failover-dashboard is a self-contained, opt-in, secure-by-default observability dashboard. Drop the dedicated starter on the classpath, enable it in YAML, and open /failover-dashboard to see every @Failover configuration plus live health metrics — rendered as cards and charts, served straight from the jar (no CDN, no build step).
It introduces no new instrumentation: it is a pure consumer of signals the framework already publishes — FailoverScanner for configuration and the Micrometer failover.* meters for metrics.
Obtaining the Dashboard¶
The default failover-spring-boot-starter ships none of this. Add the dedicated starter:
<dependency>
  <groupId>com.societegenerale.failover</groupId>
  <artifactId>failover-dashboard-spring-boot-starter</artifactId>
</dependency>
Adding the jar makes the dashboard available, not active. Nothing is mapped until you enable it.
Enabling It¶
enabled is the only switch you must set — everything else has a working default:
Once enabled, the UI and the full JSON API are served. The granular flags below exist only to narrow exposure, never to opt in to it.
| URL | Serves |
|---|---|
/failover-dashboard | the UI (bare path forwards to index.html) |
/failover-dashboard/api/config | every @Failover point + global settings |
/failover-dashboard/api/config/settings | effective global failover.* / failover.dashboard.* config, grouped |
/failover-dashboard/api/failover-health | actuator-style overall status + active configuration |
/failover-dashboard/api/metrics | global + per-API KPIs and rates |
/failover-dashboard/api/metrics/source | metrics provenance (mode, instances reporting, freshness) for the UI source badge |
/failover-dashboard/api/health | per-API health classification |
/failover-dashboard/api/metrics/series | trend samples — local: the in-memory ring (empty unless history is enabled); mode=prometheus: cluster-wide via query_range |
/failover-dashboard/api/instances | per-instance metrics for the Instances tab — empty in local (single JVM); populated in shared-store / prometheus |
/failover-dashboard/api/cluster/snapshot | (shared-store only, POST) peer snapshot ingest |
base-path is a single dedicated, non-root namespace covering both the UI and the API; override it to relocate the whole dashboard. server.servlet.context-path still prepends as usual.
Configuration¶
Every failover.dashboard.* property in one place. enabled is the only one you need — the rest have working defaults and exist to narrow exposure, secure the gate, or turn on trend history.
failover:
  dashboard:
    enabled: false                   # master switch (secure-by-default) — set true to map anything
    base-path: /failover-dashboard   # single dedicated namespace for the UI + API
    exposure:                        # defaults expose everything; set flags only to NARROW
      ui: true                       # serve the static HTML/JS UI
      api: true                      # serve the JSON API
      include: [config, failover-health, metrics, health, cluster, instances]  # which API endpoints are served
    security:
      role: FAILOVER_ADMIN           # role required for base-path/** when Spring Security is present
      allow-insecure: false          # start unsecured + loud WARN when Spring Security is absent
                                     #   (dev / trusted-network only; REFUSED under the 'prod' profile)
    history:                         # opt-in server-side trend ring buffer (see Trend History below)
      enabled: false                 # enable the sampler + /api/metrics/series endpoint
      samples: 120                   # ring-buffer capacity (retained sample count)
      sample-interval-seconds: 15    # seconds between samples
    health:                          # healthyRate thresholds for the per-API status badge
      degraded-threshold: 0.99       # >= ⇒ HEALTHY; below (down to unhealthy floor) ⇒ DEGRADED
      unhealthy-threshold: 0.90      # >= ⇒ DEGRADED; below ⇒ UNHEALTHY
    cluster:                         # where metrics are read from across instances (see Distributed Deployment)
      mode: local                    # local (default) | prometheus | shared-store
      prometheus:                    # used when mode=prometheus (aggregates failover.* across instances)
        base-url: ""                 # e.g. http://prometheus:9090 (blank ⇒ falls back to local)
        token: ""                    # optional bearer token (blank ⇒ none)
        timeout-seconds: 5           # per-query connect/read timeout
      shared-store:                  # used when mode=shared-store (peers push snapshots, aggregated in-app)
        store: inmemory              # inmemory (default) | jdbc (needs failover-dashboard-snapshotstore-jdbc)
        max-instances: 10            # supported ceiling (warns beyond — graduate to prometheus)
        instance-retention: 7d       # retire unseen instances from the Instances tab (counts stay in the aggregate; 0 ⇒ never)
        sample-interval-seconds: 30  # cluster-trend sampling cadence
        retention:
          max-age: 7d                # trend-history age bound
          max-entries: 100000        # trend-history size bound (oldest truncated)
        jdbc:                        # used when store=jdbc
          table-prefix: ""           # prepended to FAILOVER_DASHBOARD_SNAPSHOT (validated)
          auto-ddl: true             # create the table on startup if missing
      snapshot:                      # peer-side push (every instance, incl. non-UI nodes)
        publish-url: ""              # dashboard ingest URL (blank ⇒ this instance does not push)
        interval-seconds: 15         # seconds between snapshot pushes
| Property | Default | Purpose |
|---|---|---|
enabled | false | Master switch. Nothing is mapped until true. |
base-path | /failover-dashboard | Dedicated namespace for UI + API. Must start with /, not be /, no trailing / — else the context fails fast. |
exposure.ui | true | Serve the static UI. false = API-only. |
exposure.api | true | Serve the JSON API. false = UI-only. |
exposure.include | all of them | API endpoints served: config, failover-health, metrics, health, cluster, instances. Trim to narrow; an omitted endpoint returns 404. /api/metrics/series is gated with metrics; /api/cluster/snapshot (shared-store ingest) with cluster; /api/instances with instances. |
security.role | FAILOVER_ADMIN | Role required for base-path/** when Spring Security is present. |
security.allow-insecure | false | When Spring Security is absent: false fails fast (fail-closed); true starts unsecured with a loud WARN. Refused under the prod profile. |
history.enabled | false | Turn on the server-side trend ring buffer + /api/metrics/series. |
history.samples | 120 | Retained sample count (ring-buffer capacity). |
history.sample-interval-seconds | 15 | Seconds between samples. |
health.degraded-threshold | 0.99 | Healthy-rate floor for HEALTHY. |
health.unhealthy-threshold | 0.90 | Healthy-rate floor for DEGRADED; below is UNHEALTHY. |
cluster.mode | local | Where metrics are read from. local = this instance's registry (default). prometheus aggregates failover.* across instances via the Prometheus HTTP API. shared-store aggregates pushed per-instance snapshots in-app (small clusters, no Prometheus). See Distributed Deployment. |
cluster.prometheus.base-url | "" | Prometheus base URL for mode=prometheus (e.g. http://prometheus:9090). Blank, or unreachable at runtime, falls back to the local registry with a warning. |
cluster.prometheus.token | "" | Optional bearer token for Prometheus. |
cluster.prometheus.timeout-seconds | 5 | Per-query connect/read timeout. |
cluster.shared-store.store | inmemory | inmemory (default) or jdbc (durable; needs the failover-dashboard-snapshotstore-jdbc module + a DataSource). |
cluster.shared-store.liveness-seconds | 180 | Heartbeat age threshold — instance is DOWN after this many seconds without a heartbeat ping. Default matches 3 × the peer default heartbeat.interval-seconds (60s). |
cluster.shared-store.max-instances | 10 | Supported small-cluster ceiling; exceeding it logs a warning. |
cluster.shared-store.instance-retention | 7d | Retire instances not seen for this long from the Instances tab (their counts stay in the aggregate; 0 keeps every instance forever). |
cluster.shared-store.sample-interval-seconds | 30 | Cluster-trend sampling cadence. |
cluster.shared-store.retention.max-age / .max-entries | 7d / 100000 | Trend-history age and size bounds (oldest truncated). |
cluster.shared-store.jdbc.table-prefix / .auto-ddl | "" / true | Snapshot table prefix (validated) + auto-create, when store=jdbc. |
cluster.snapshot.publish-url / .interval-seconds | "" / 15 | Peer-side push. Set to the dashboard's base URL (same as base-path on the dashboard host): http://<host>:<port>/failover-dashboard. The snapshot and heartbeat endpoints are derived automatically (/api/cluster/snapshot, /api/cluster/heartbeat). Blank ⇒ this instance does not push. |
cluster.snapshot.username / .password | "" | HTTP Basic Auth credentials for the ingest endpoint. Ignored when oauth2-client-registration-id is set. |
cluster.snapshot.oauth2-client-registration-id | "" | Spring OAuth2 client id for Bearer auth (takes priority over Basic). |
cluster.snapshot.allow-insecure-ingest | false | Suppress the no-auth startup warning (dev / trusted network only). |
cluster.snapshot.heartbeat.enabled | false | Send lightweight heartbeat pings from this peer. Off by default. publish-url must be set; heartbeat URL is always derived as {publish-url}/api/cluster/heartbeat. |
cluster.snapshot.heartbeat.interval-seconds | 60 | Ping cadence. Keep ≤ ⅓ of the dashboard liveness-seconds. |
See the Properties Reference for the canonical table.
The Toolbar¶
Every view shares the top bar:
- Status chip — overall live status (
Healthy/Degraded/Unhealthy), derived from the worst per-API health. - Tabs —
Overview,Per-API,Instances(cluster modes only — hidden inlocal),Health,Config(Overview is the default; the open tab is kept in the URL hash, e.g.#per-api). - Auto-refresh — selectable cadence:
off,10s,30s,1m,10m,1h(default30s). - Refresh now (
⟳) — reload immediately, independent of the cadence. - Last-updated — timestamp of the last successful load.
- Theme toggle (
◐) — switch dark / light (or force it with?theme=dark/?theme=light). - Docs — the failover icon opens this documentation in a new tab.
All controls carry hover tooltips. Dark is the default "control-room" theme; both themes are shown for each view below.
The Views¶
Overview¶
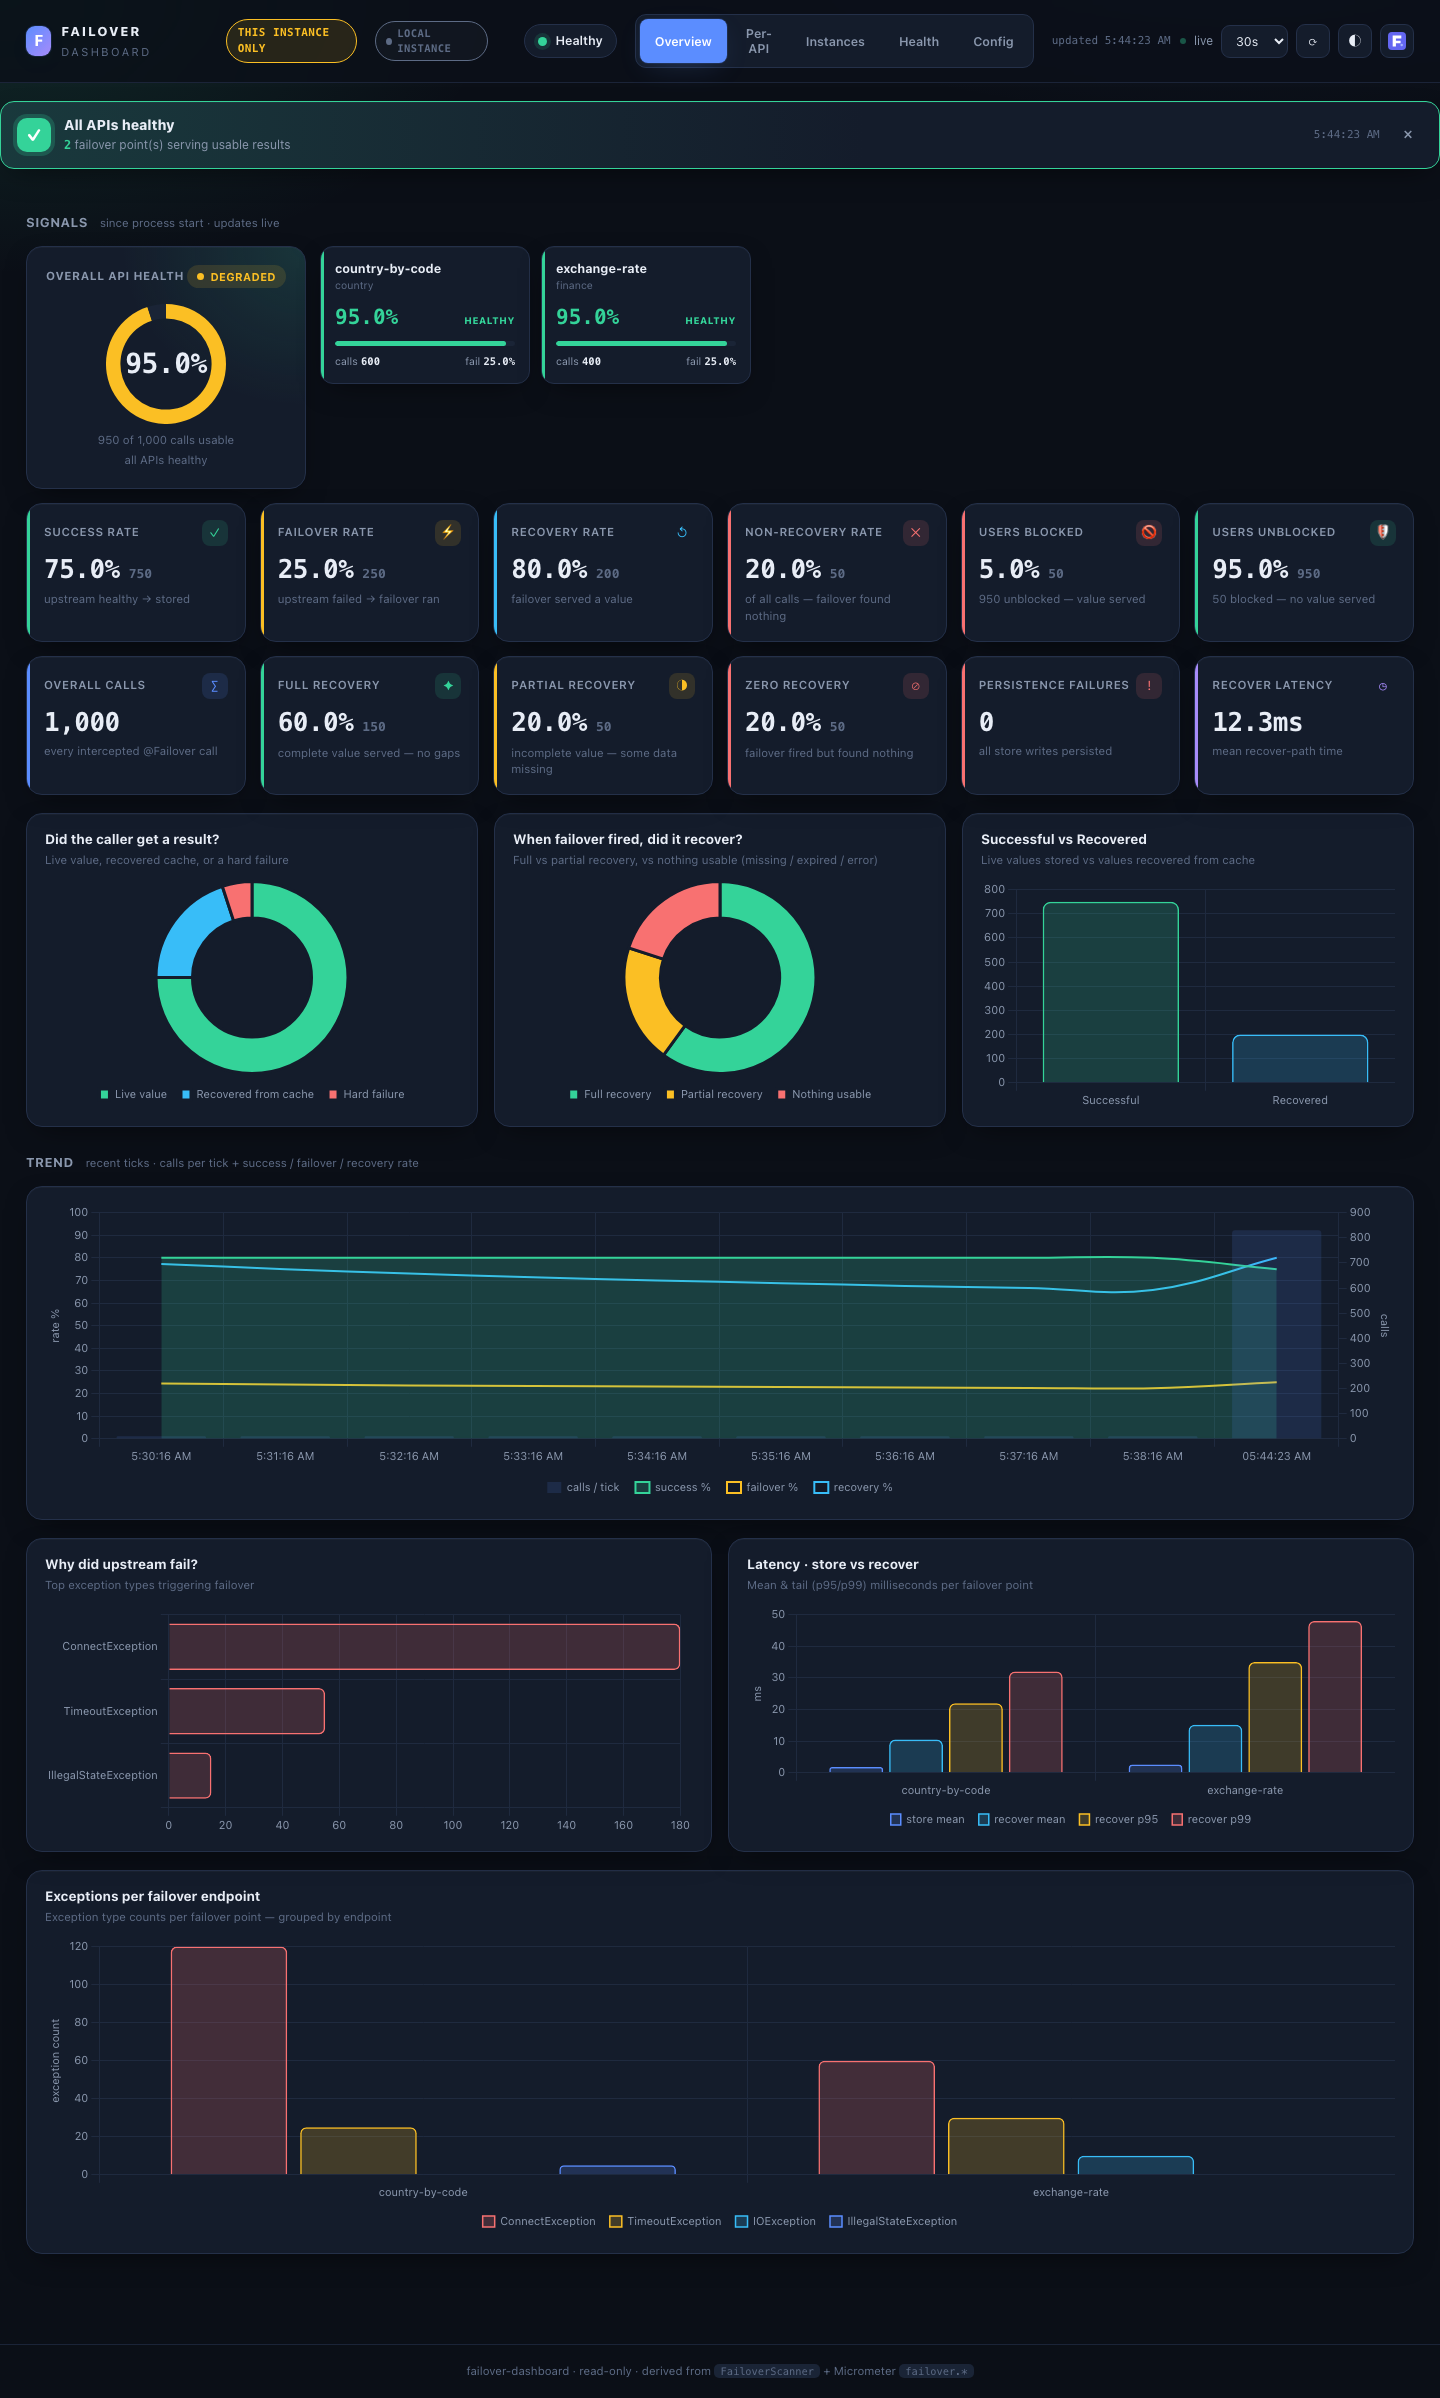
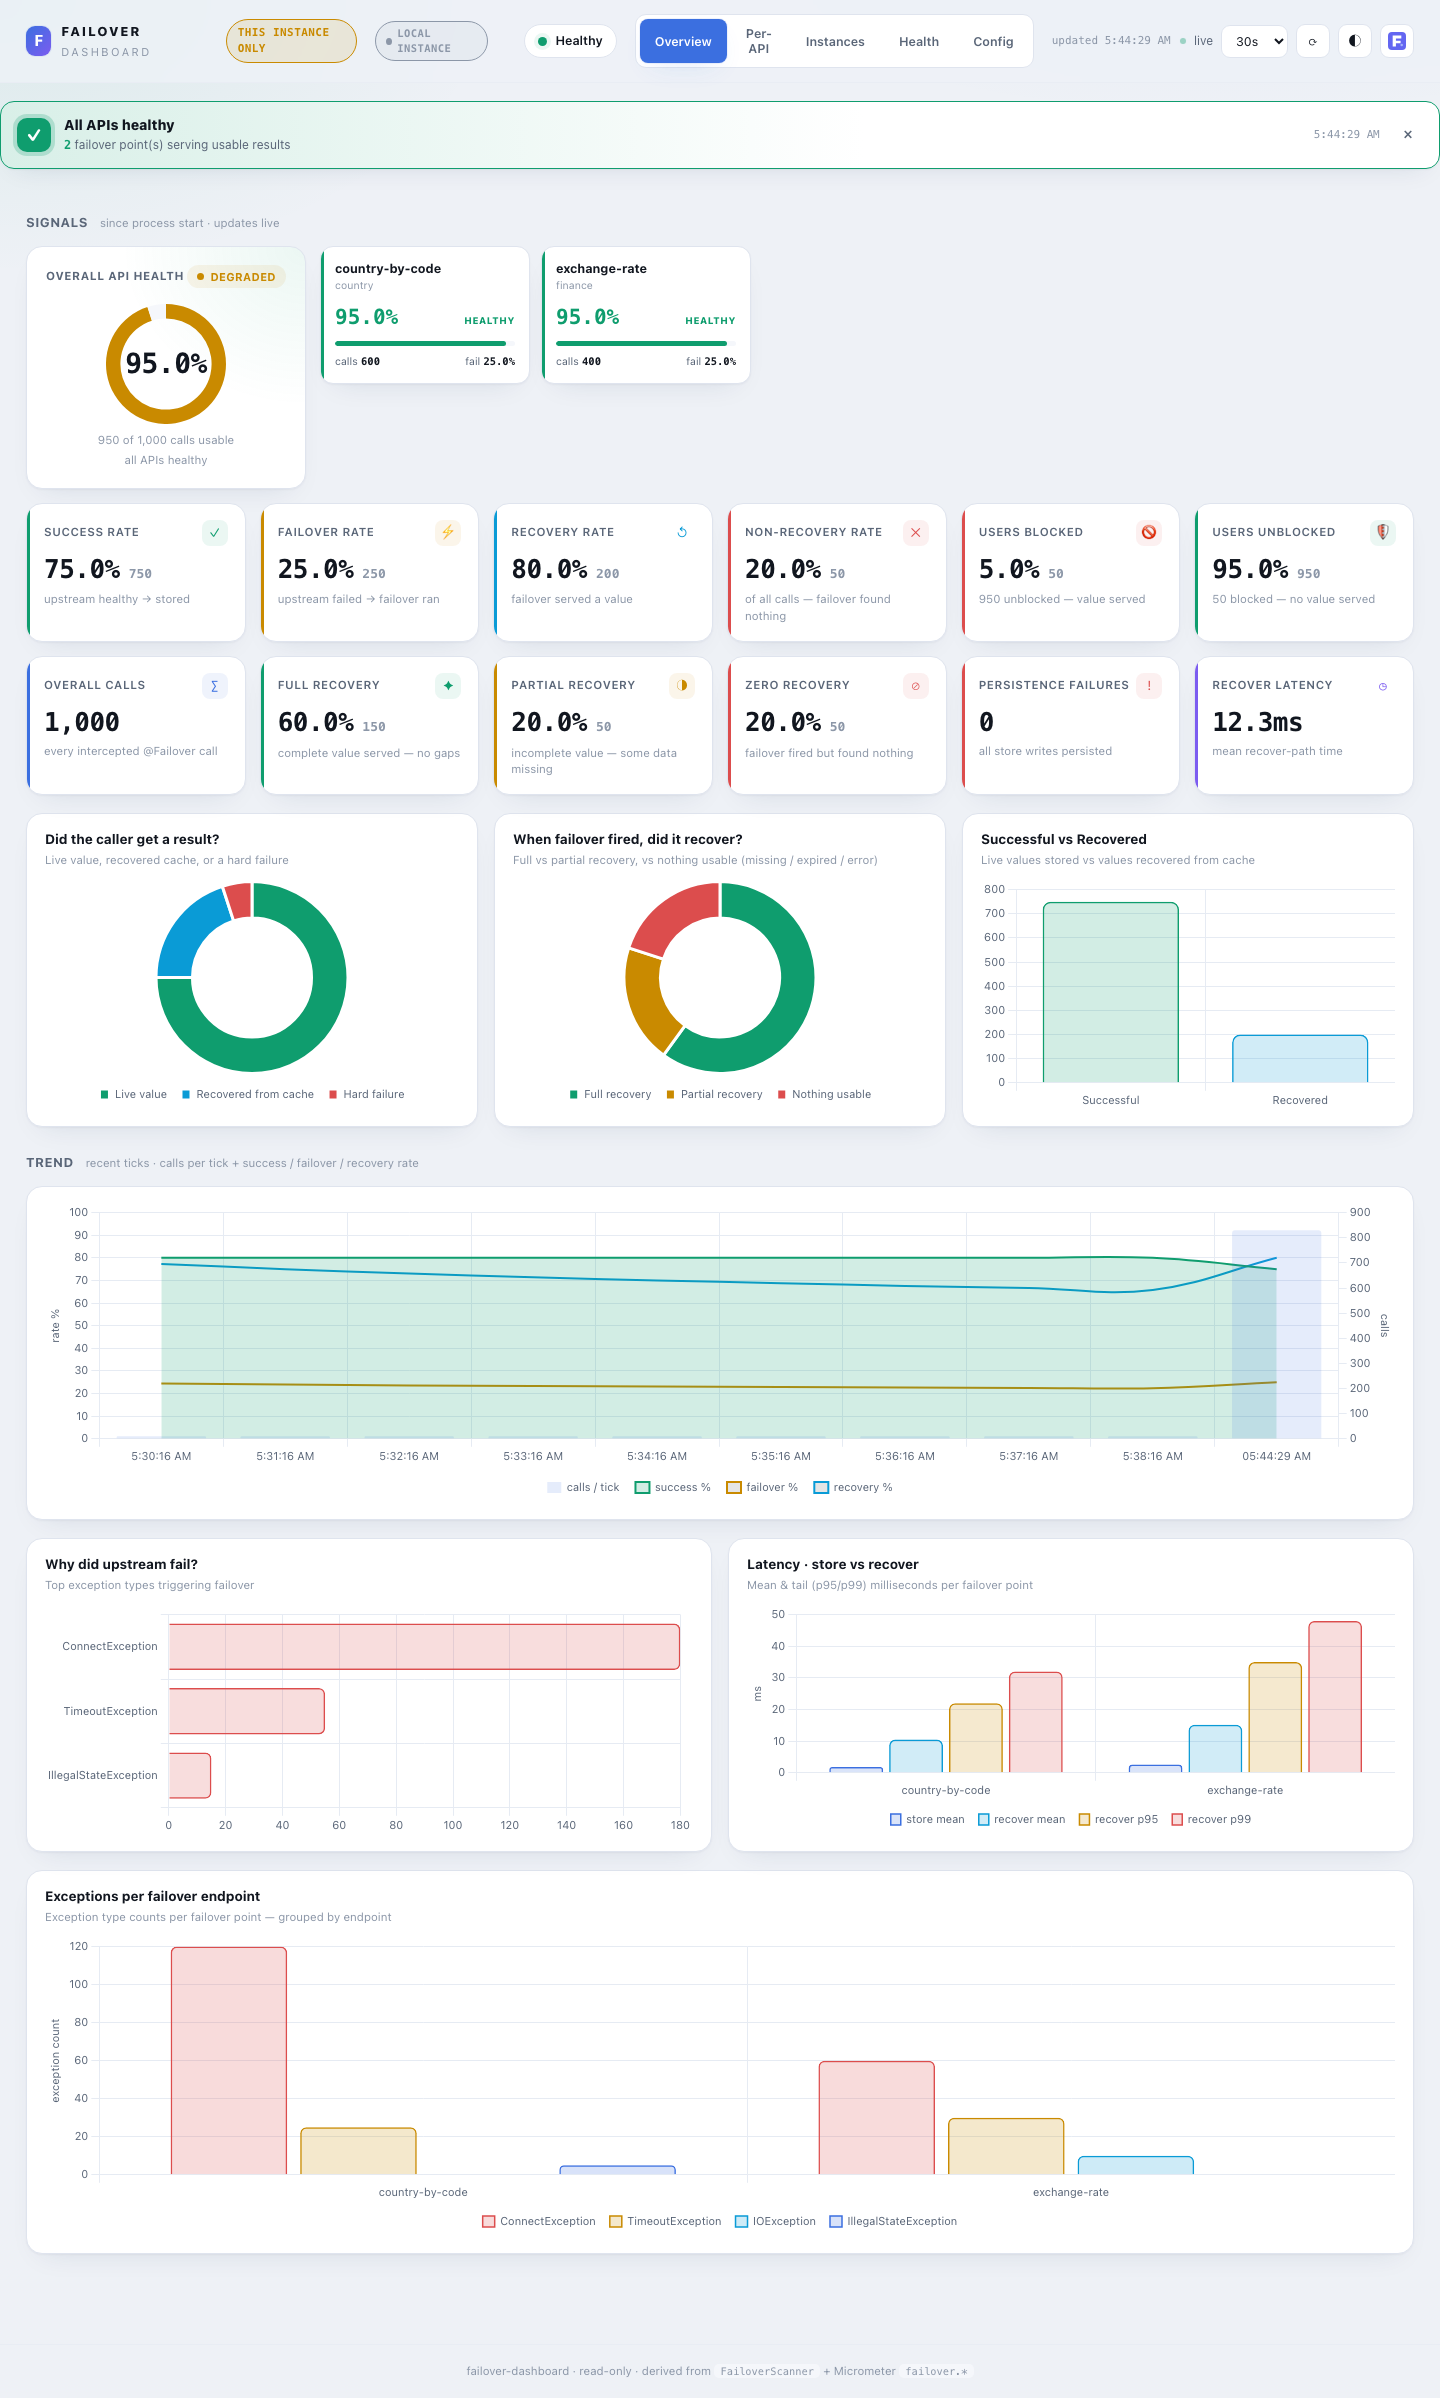
The at-a-glance health and KPI surface.
- Health banner — a closable, colour-coded summary shown on each load: all APIs healthy (green), N need attention (amber, names listed), or N unhealthy — action needed (red).
- Signals — row 1 (health): a large Overall API Health gauge (the
(success + recovered) / totalhealthy-served rate) beside a grid of per-API health cards, sorted worst-first so a struggling API surfaces top-left. Each card shows its health %, status, calls and failover %. - Signals — row 2 (metrics): one card per KPI — Overall calls, Success rate, Failover rate, Recovery rate, Non-recovery rate (each rate shows the underlying count too), Persistence failures (async store writes that were lost — alert on any non-zero), and Recover latency (mean recover-path ms).
- Charts: Did the caller get a result? (live value / recovered / hard failure), When failover fired, did it recover? (full / partial / nothing usable — partial = scatter-gather slices), Successful vs Recovered, a full-width Trend (calls per tick + success / failover / recovery rate over time), Why did upstream fail? (top exception types), and Latency — store vs recover per API.
Per-API¶
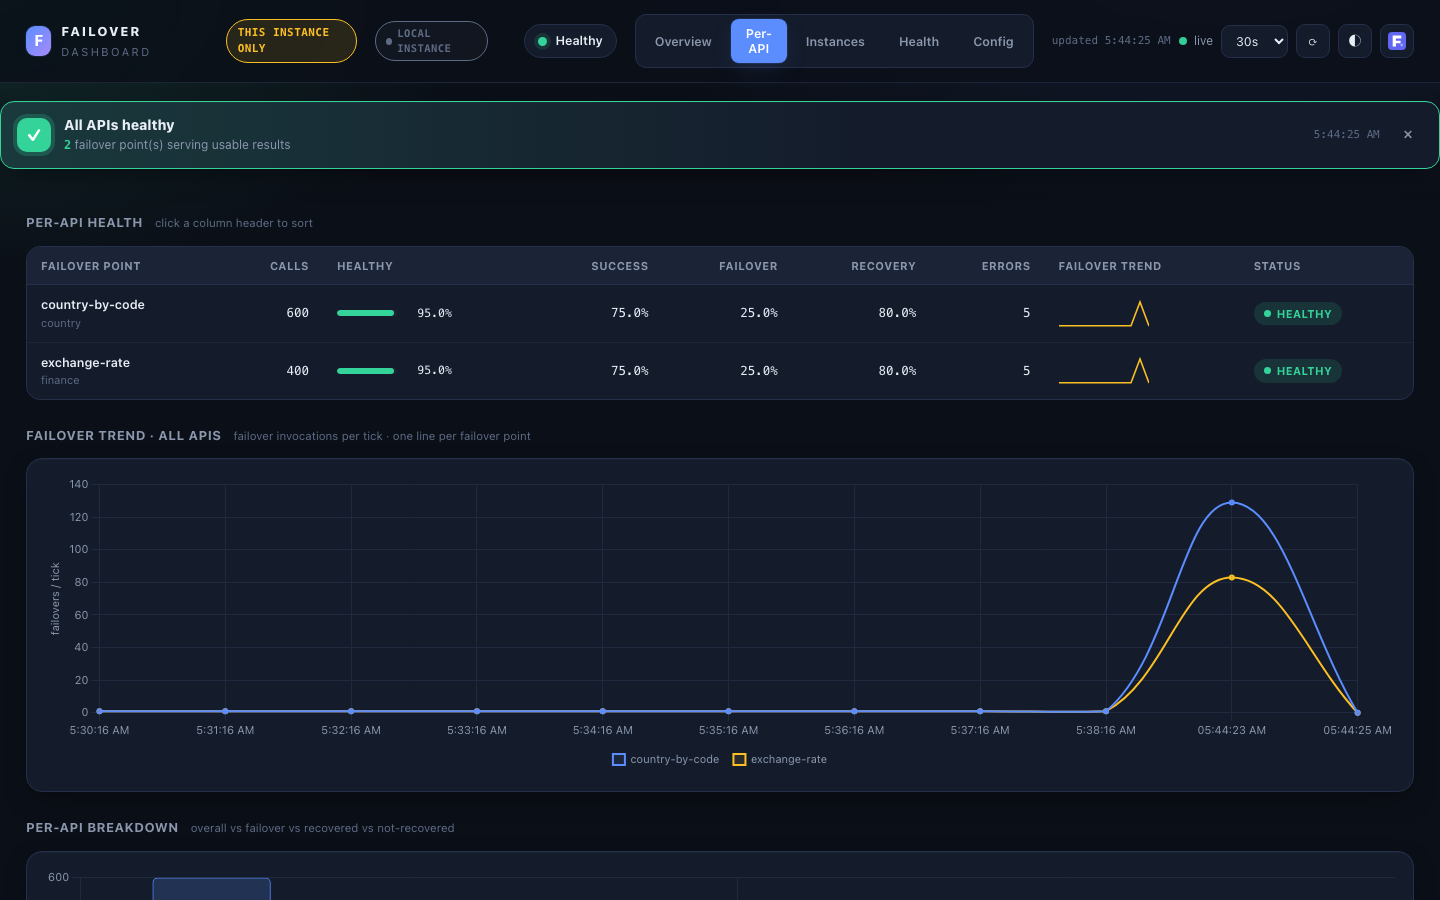
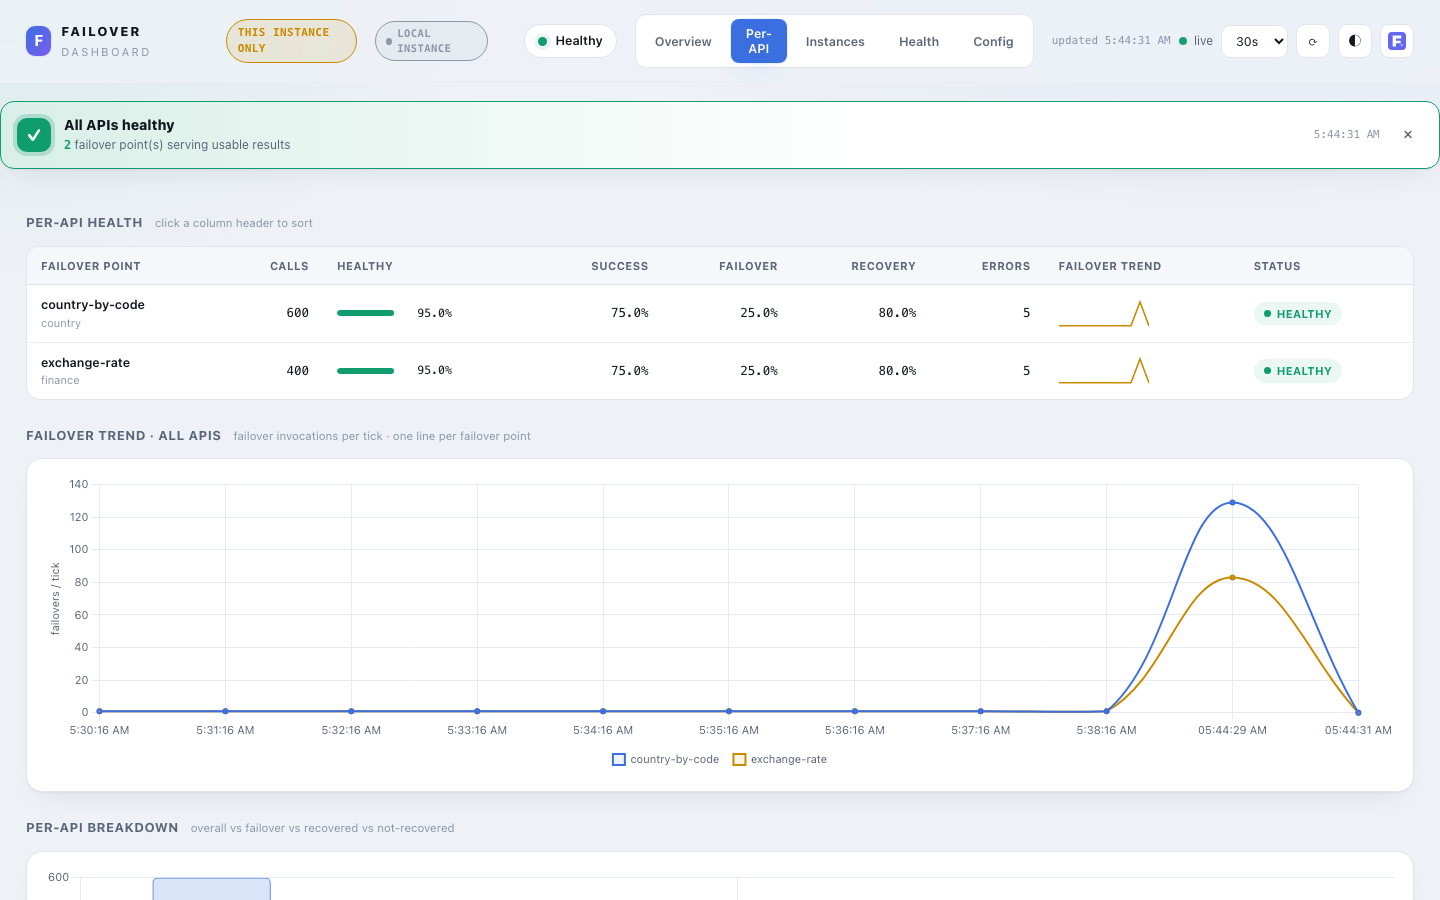
Drill-down per failover point.
- Per-API health table — sortable (click any header): calls, healthy-rate bar, success / failover / recovery %, errors, an inline failover-trend sparkline, and a
HEALTHY/DEGRADED/UNHEALTHYbadge. - Failover trend — all APIs — one line per failover point, failover invocations per tick.
- Per-API breakdown — grouped bars: overall vs failover vs recovered vs not-recovered.
- Latency (on Overview) shows store/recover mean plus p95/p99 when available (
local+prometheus);shared-storeshows mean/max only (percentiles can't be merged from per-instance snapshots).
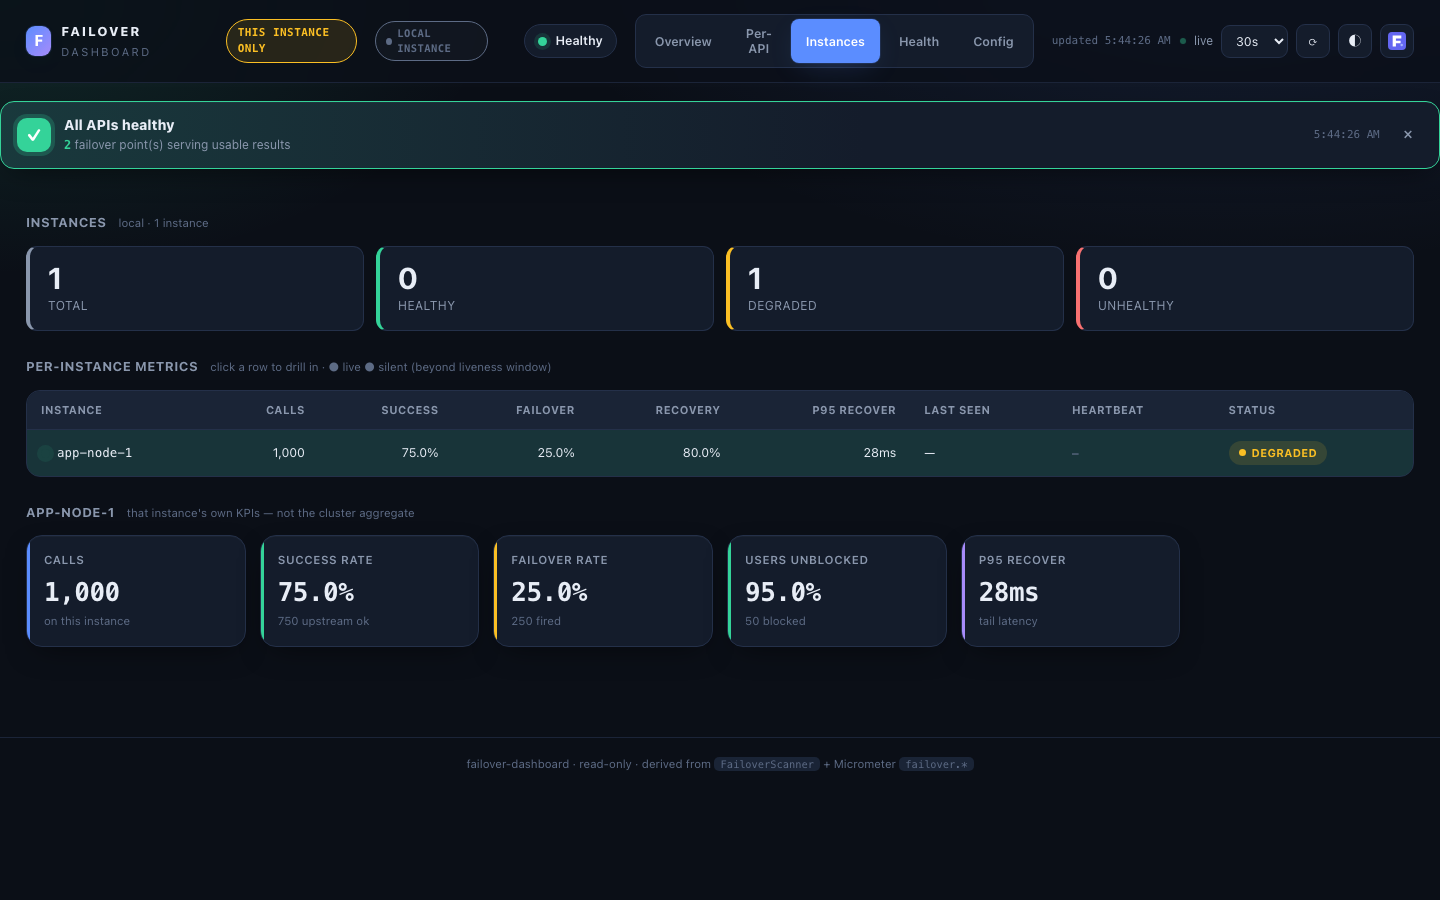
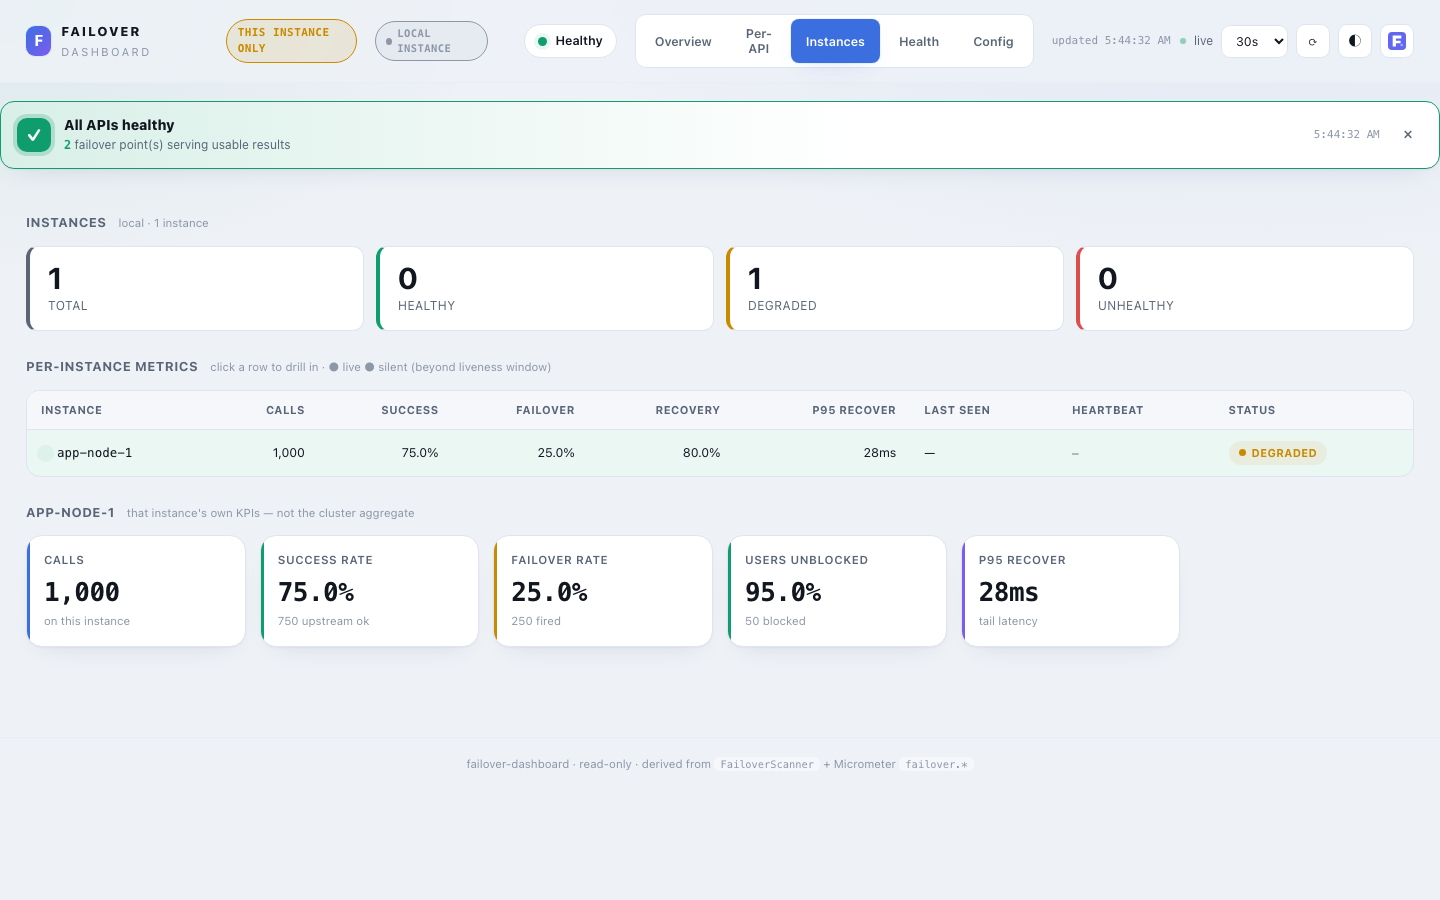
Instances¶
Cluster only — shown when the dashboard reads from a multi-instance source (shared-store or prometheus); hidden for local. Answers the first incident question: one bad node, or all of them?
- Roll-up cards — Total · Reporting · Silent · Healthy · Degraded · Unhealthy. Silent = expected-but-not-reporting (beyond the liveness window in
shared-store). - Per-instance table — a row per instance: id, live/silent dot, calls, success / failover / recovery %, p95 recover, last-seen, and a status badge. Click a row to drill in.
- Drill-down — the selected instance's own KPIs (calls, success, failover, users-unblocked, p95) — not the cluster aggregate.
Data comes from MetricsSource.instances(): in shared-store from the per-instance snapshots the store already holds; in prometheus from sum by (name, instance) (failover_*) queries. In shared-store, instances unseen past instance-retention are retired from this tab (their counts remain in the cluster aggregate — see Instance churn).
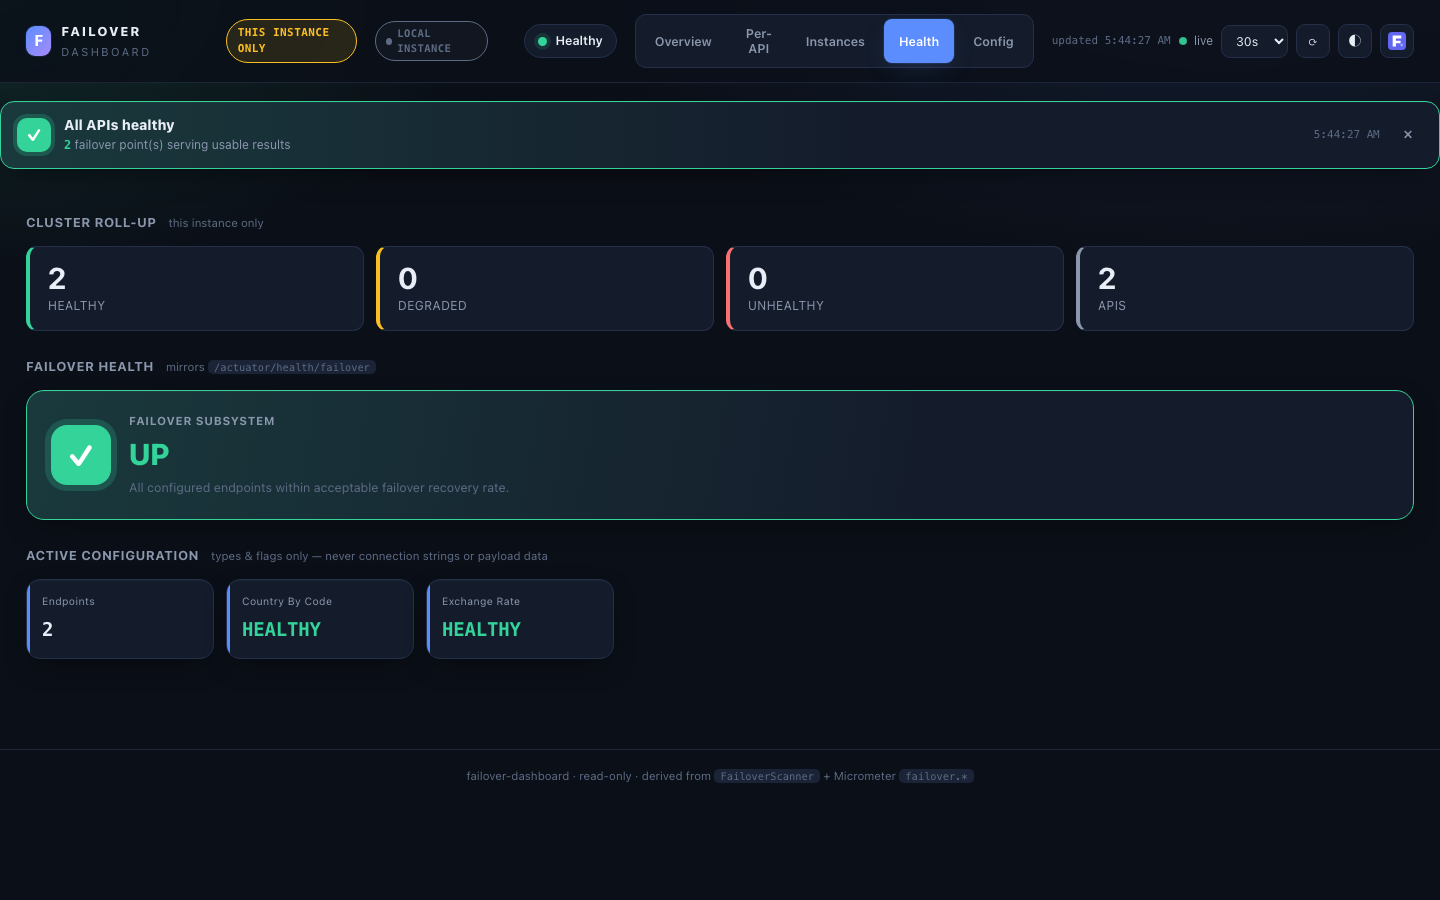
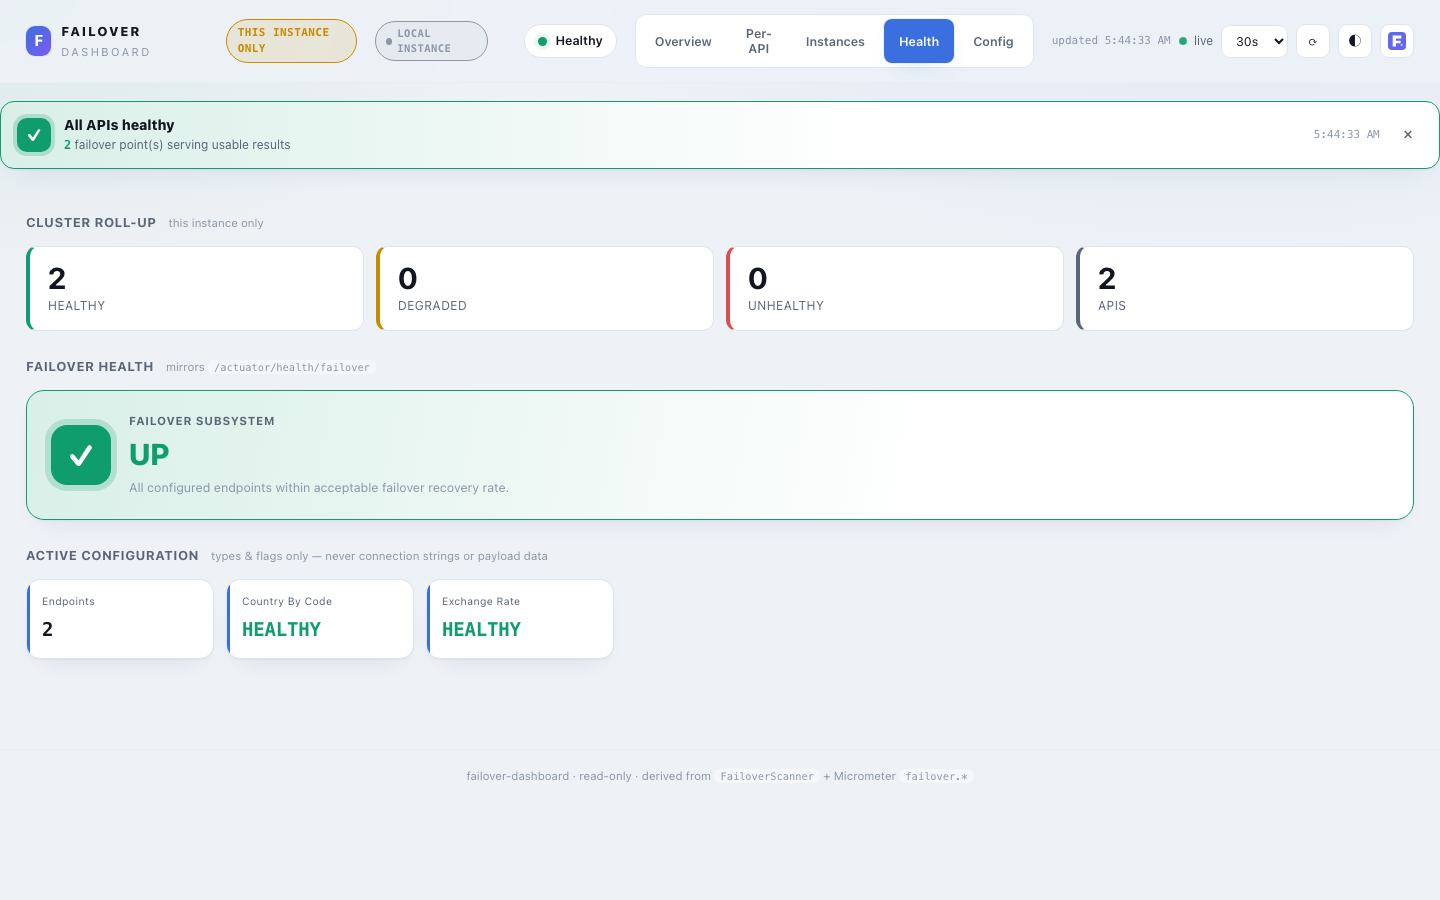
Health¶
Actuator-style subsystem health, mirroring the /actuator/health/failover contributor.
- Cluster roll-up — healthy / degraded / unhealthy API counts + instances reporting, with a provenance line (local vs cluster aggregate). Cluster-wide via
MetricsSource.health()across whichever tier is active. - Status hero —
UP(at least one@Failoverregistered) orDOWN(none discovered — a misconfiguration signal). - Active configuration — the global config rendered as small stat cards (registered failovers, type, store type, async, exception policy, scheduler…). Types and flags only — never credentials or connection strings (§9).
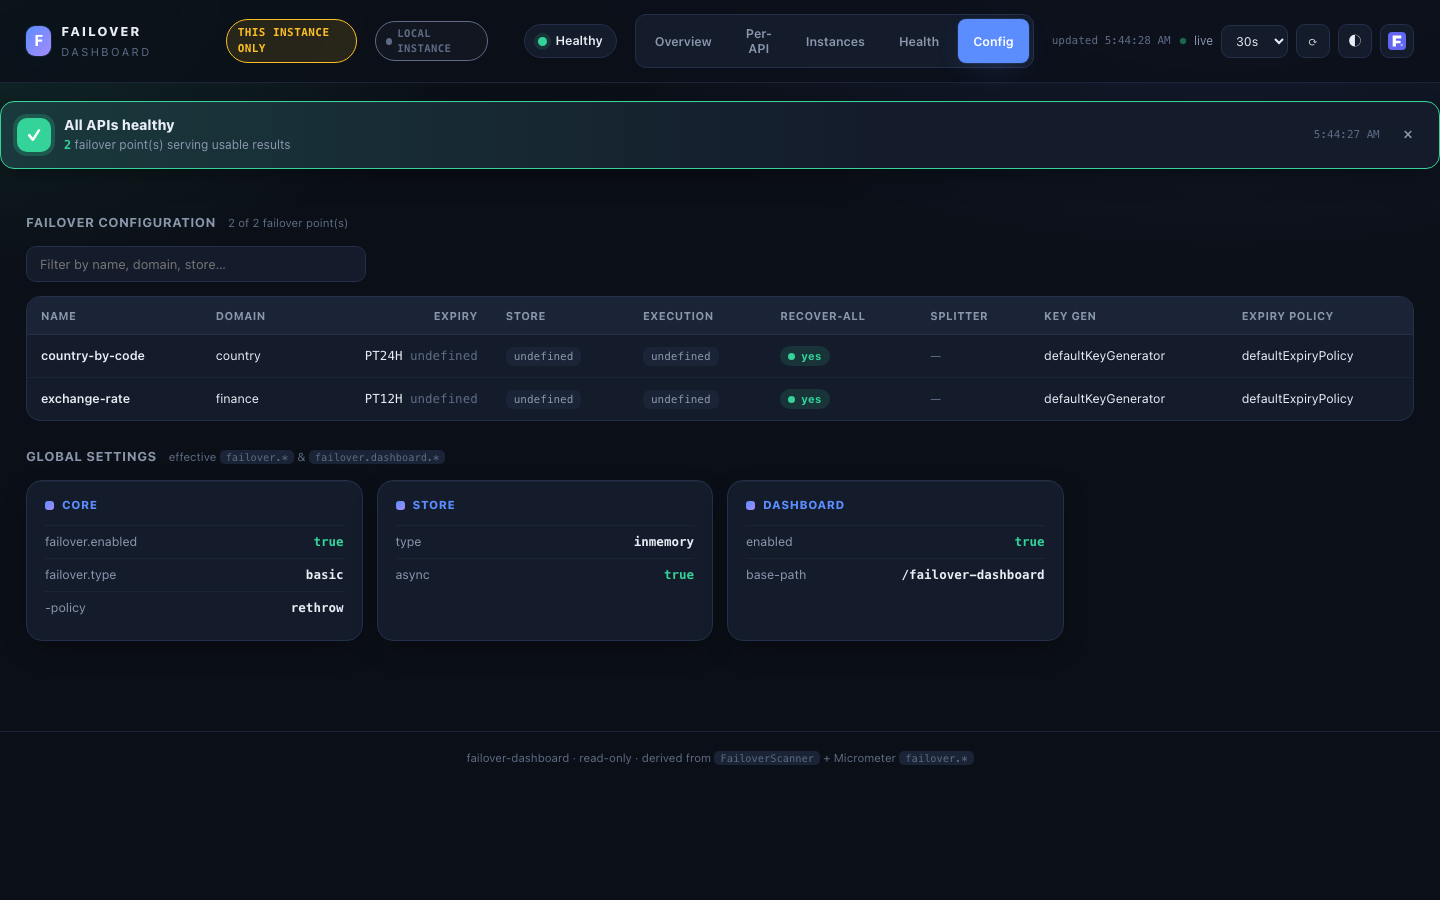
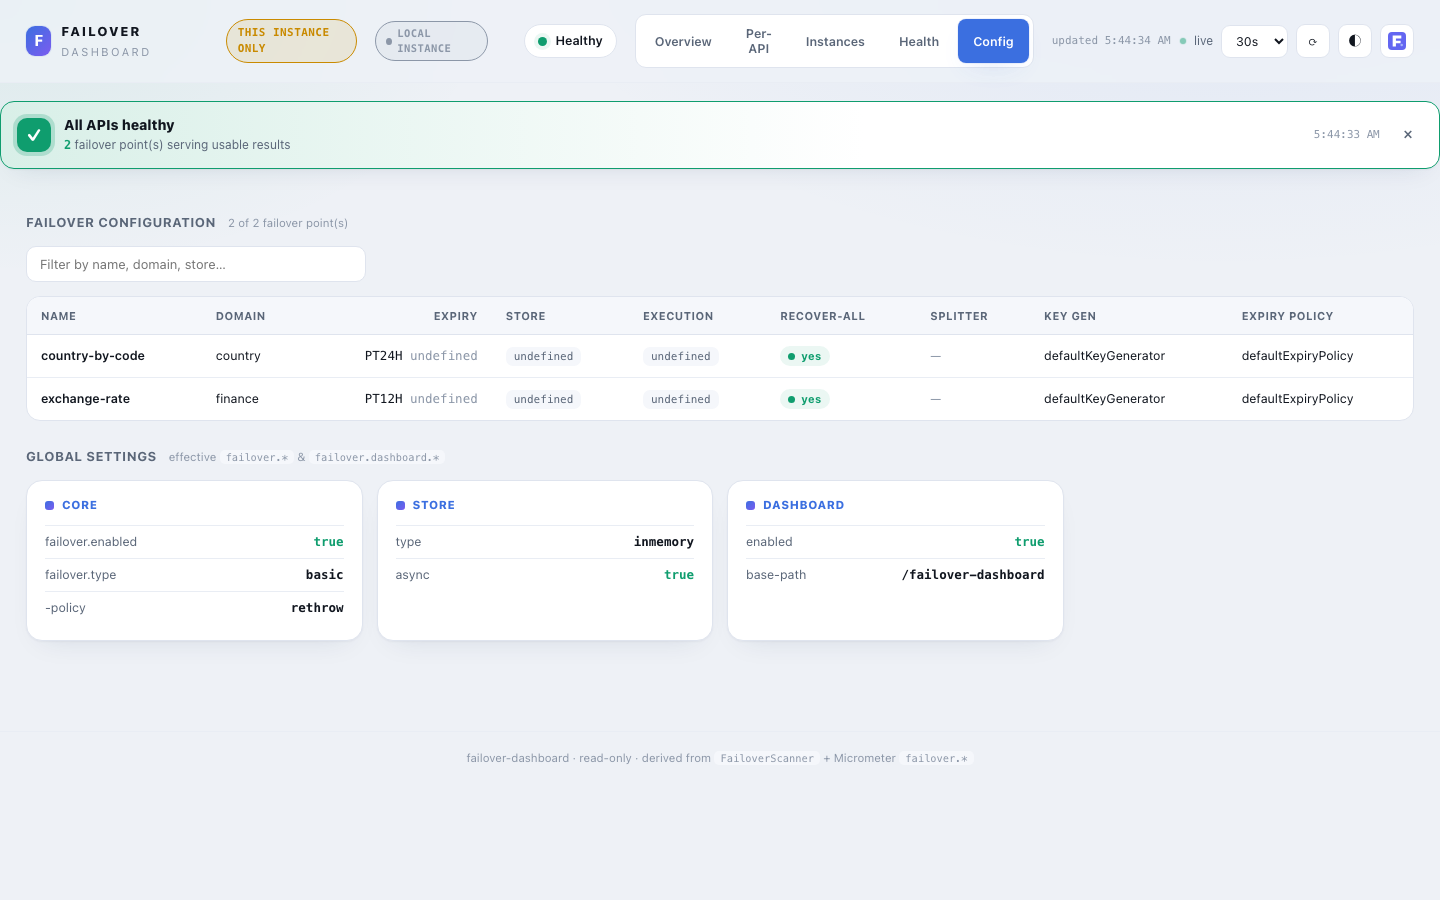
Config¶
- Failover configuration — a sortable, filterable table of every
@Failoverpoint: name, domain, expiry, store, execution, recover-all, splitter, key generator, expiry policy. Empty per-annotation overrides render asdefault. - Global settings — the effective
failover.*/failover.dashboard.*settings grouped into panels (Core / Store / Scatter / Scheduler / Dashboard). Types, flags, crons, thresholds and paths only.
KPIs — Derived, Not Measured¶
Every KPI is derived from counters that already exist (failover.store.total, failover.recovery.outcome.total, failover.recover.total). Per API, let S = stored upstream successes and F = recovered + not-recovered + error:
| KPI | Formula | Meaning |
|---|---|---|
| Success rate | S / (S+F) | upstream healthy → live value stored |
| Failover rate | F / (S+F) | upstream failed → failover flow started |
| Recovery rate | recovered / F | failover served a stored, non-expired value |
| Non-recovery rate | (not_recovered + error) / F | failover found nothing usable |
| Health (healthy-served) | (S + recovered) / (S+F) | caller got a usable result (live or recovered) |
Zero denominators yield 0, never NaN. Health is classified HEALTHY / DEGRADED / UNHEALTHY against configurable thresholds.
Three further operational signals are surfaced from existing meters (still no new instrumentation):
| Signal | Source meter | Why it matters |
|---|---|---|
| Async write failures | failover.store.async.failed | Async store writes that threw inside the executor — failover data was not persisted. Shown as a KPI, a red per-API table column, and a loud banner when non-zero. Alert on any increase. |
| Latency (mean / max) | failover.operation.duration (timer) | Wall time of the store and recover paths, per API. Mean + max only — the timer has no percentile histogram, so p95/p99 are intentionally absent. |
| Top exception types | failover.exception.total | Which upstream exception types trigger failover most — quick root-cause triage. |
Security — Fail-Closed (§9)¶
The dashboard surfaces internal operational data, so the access gate is not relaxed by the convenience defaults:
- Spring Security present (bundled by the starter): the module contributes a
SecurityFilterChainscoped tobase-path/**requiring roleFAILOVER_ADMIN(configurable). Override it with your owndashboardSecurityFilterChainbean. - Spring Security absent: the context fails fast at startup — unless
failover.dashboard.security.allow-insecure=true, which starts unsecured with a loud repeatedWARN(trusted-network / dev only). Theallow-insecureescape hatch is refused outright when theprodprofile is active: it can never silently disable the access gate in production.
A strict, static-only Content-Security-Policy is applied to every dashboard response (no remote or inline scripts; Chart.js is vendored). The API is read-only — no endpoint mutates state. Only annotation metadata and aggregate counts are exposed — never payload data, keys, credentials, or connection strings.
http.authorizeHttpRequests(a -> a.requestMatchers("/failover-dashboard/**").hasRole("FAILOVER_ADMIN"));
Trend History (opt-in)¶
By default the trend charts (the call/rate timeline and per-API failures) are buffered client-side, so they live only as long as the tab is open — a browser reload clears them and they rebuild from the next poll. This is by design and harmless: the cumulative KPIs, per-API counts and health table are re-derived from the server-side failover.* counters on every load, so none of those numbers are lost on reload — only the in-tab trend lines reset.
For reload-surviving trends, enable the server-side ring-buffer sampler:
failover:
  dashboard:
    history:
      enabled: true            # default false — registers the sampler + /api/metrics/series
      samples: 120             # ring-buffer capacity (retained sample count)
      sample-interval-seconds: 15   # seconds between samples
How it works. A scheduled sampler snapshots the global cumulative failover.* counters every sample-interval-seconds into a bounded in-memory ring of samples entries (oldest evicted when full). The retained window is therefore:
Size it for the span you want visible: e.g. samples: 240, sample-interval-seconds: 15 ≈ 1 hour; samples: 120, sample-interval-seconds: 60 ≈ 2 hours at coarser resolution. The buffer is a fixed memory cost (samples small records), independent of traffic.
The /api/metrics/series endpoint. Returns the retained samples (global cumulative totals per timestamp) in chronological order. It accepts an optional windowSec query param — only samples within that many seconds of now are returned; windowSec=0 returns all retained (the UI uses 0 on load). The endpoint is registered only when history.enabled=true, and is gated by the metrics exposure flag (exposure.include) and the same access gate as the rest of the dashboard.
UI behaviour. When enabled, the Overview hydrates the call/rate timeline from /api/metrics/series on load, so a browser reload keeps its trend instead of starting blank; live polling then continues seamlessly from the last sample. The chart deltas consecutive cumulative samples (calls per interval) and derives the failover / recovery / non-recovery rates. (The per-API failures chart remains live-only — /series carries global totals, not per-API.) With history disabled the endpoint is absent and the UI silently falls back to the client-side buffer.
It is process-local and lost on restart — deliberately not a TSDB. For long-term, cross-restart analysis, point Prometheus/Grafana at the existing failover.* meters.
Graceful Degradation¶
If Micrometer is not on the classpath, the Config and Health views still work; the Overview / Per-API views show a friendly "metrics unavailable" notice. If the Chart.js asset is missing, KPI cards and tables still render and a notice replaces the charts.
The Read Axis (dashboard service) — how the dashboard collects metrics¶
The read axis = the dashboard service: it never emits failover.* meters, it reads and aggregates them through a MetricsSource chosen by cluster.mode. The same UI/API sits on top of all three sources. (The write axis = the failover service that emits the meters — see Observability.)
Single instance (local)¶
One JVM. The dashboard reads its own in-process registry directly — exactly the meters this instance emitted.
flowchart LR
    A["@Failover (this JVM)"] --> M["Micrometer registry"]
    M --> LS["LocalRegistryMetricsSource"]
    LS --> UI["Read axis — dashboard service<br/>UI / JSON API"]
Behind a load balancer this is only one node's view — the UI labels it "this instance only". For a true cluster picture, pick shared-store or prometheus.
Multiple instances — shared-store (no Prometheus)¶
Each instance pushes its own KPI snapshot to the dashboard; the dashboard keeps the latest per instance and aggregates them in memory with the same DashboardKpis math. Small clusters (≤ ~10), zero external infra.
flowchart LR
    subgraph APPS["Write axis — failover service · N instances"]
        I1["instance-1"]; I2["instance-2"]; I3["instance-3"]
    end
    I1 & I2 & I3 -->|"POST /api/cluster/snapshot<br/>(every interval-seconds)"| ING["ClusterSnapshotController"]
    ING --> ST["SnapshotStore<br/>(in-memory | JDBC)"]
    ST --> SS["SharedStoreMetricsSource<br/>sum latest-per-live-instance"]
    SS --> UI["Read axis — dashboard service<br/>UI / Instances tab"]
Counts are never dropped from the aggregate: last-known values always contribute, and a peer restart (counter reset) folds the pre-restart totals into a carried-forward baseline, so cluster totals never shrink. Instances not seen within instance-retention (default 7 days) are retired from the Instances tab — keeping the store bounded under pod churn — while their counts keep contributing to the aggregate; a retired instance that reports again resumes with its history intact. Per-instance staleness is visible through each row's last-seen timestamp. store: jdbc makes snapshots (including the carried baseline) survive a dashboard restart.
Counter resets — how the aggregate stays monotonic (ADR 67)¶
Peer snapshots carry cumulative Micrometer counter totals, and those totals reset to zero when the peer process restarts. Two mechanisms keep the two cluster views consistent despite that:
- Trend graph —
ClusterSeriesSamplersamples the merged aggregate on a schedule and accumulates a monotonic adjusted series: per field it addsmax(increase, freshValueAfterReset), so a reset never produces a dip or a negative delta. - Instant aggregate (Overview cards, Health tab) — on every snapshot ingest the store compares the incoming cumulative total against the instance's previous raw snapshot. A drop can only mean a restart, so the previous raw totals are folded into a per-instance baseline (
SnapshotBaseline), and the summary served for that instance is alwaysbaseline + raw. Repeated restarts accumulate into the same baseline. Withstore: jdbcthe baseline is persisted (nullableBASELINE_JSONcolumn), so it also survives a dashboard restart.
Both views apply the same detection rule, so cards and graph agree after a peer restart. Known limit: a reset is invisible if the peer regrows past its previous total within one push interval (15 s by default) — the same theoretical window Prometheus rate() has; at most one interval of events can be undercounted.
Instance churn — bounded retirement¶
Under Kubernetes-style deploys every new pod is a new instanceId, and the tier's invariant is that a dead peer's counts must keep contributing. Retirement reconciles the two:
- An instance with no snapshot for
instance-retention(default7d) moves out of the active map: gone from the Instances tab andallInstances(), but itsbaseline + rawcounts keep contributing viaSnapshotStore.retiredAggregate(). - A retired instance that pushes again (e.g. a StatefulSet pod reusing its name) is promoted back with history intact; normal reset detection then applies.
- At most 100 retired entries are kept individually; beyond that the oldest are compacted into a single immutable tombstone aggregate — a hard heap bound regardless of churn rate.
Set instance-retention: 0 to disable retirement (previous retain-forever behaviour). Retirement applies to the in-memory store only — JDBC rows are durable and cheap, so that store retains all instances.
Multiple instances — prometheus (large clusters)¶
Prometheus scrapes every instance; the dashboard issues read-only PromQL to aggregate cluster-wide (incl. p95/p99 and per-instance) and falls back to local if Prometheus is down.
flowchart LR
    subgraph APPS["Write axis — failover service · N instances"]
        I1["instance-1<br/>/actuator/prometheus"]; I2["instance-2<br/>/actuator/prometheus"]; I3["instance-3<br/>/actuator/prometheus"]
    end
    I1 & I2 & I3 -->|scrape| PROM[(Prometheus)]
    PROM -->|"PromQL: sum by (name[, instance])"| PS["PrometheusMetricsSource"]
    PS --> UI["Read axis — dashboard service<br/>UI / Instances tab"]
Picking a mode¶
flowchart TB
    Q{how many instances?} -->|one| L["local — read own registry"]
    Q -->|"a few (≤ ~10)"| S{run Prometheus?}
    Q -->|many| P["prometheus"]
    S -->|no| SH["shared-store<br/>(in-memory, or jdbc for durability)"]
S -->|yes| P| Mode | Source | Infra | Per-instance view |
|---|---|---|---|
local | in-process registry | none | n/a (single JVM) |
shared-store | pushed snapshots, in-app aggregate | none, or a DB table (jdbc) | yes (snapshot per instance) |
prometheus | PromQL across scraped instances | Prometheus/TSDB | yes (instance label) |
Pairing the read axis with your write-axis backend¶
The read axis has only these three sources — it does not read every metrics backend. So the dashboard's cluster.mode does not always mirror the Micrometer registry you export with (Observability → choosing a registry). Map it like this:
| Write axis (export registry) | Dashboard read axis | Cluster view comes from |
|---|---|---|
| Prometheus (scrape) | cluster.mode=prometheus (+ prometheus.base-url) | the embedded dashboard, via PromQL — 1:1 pairing |
| OTLP / Elastic / Datadog / New Relic / CloudWatch / Influx / Graphite (push) | cluster.mode=shared-store or none | the vendor's own UI (Grafana / Kibana / Datadog…) for those exported meters; or the embedded dashboard via shared-store (peers push KPI snapshots straight to it — independent of the metrics backend) |
| none / SimpleMeterRegistry (single JVM) | cluster.mode=local (default) | this instance only |
Key point: shared-store is independent of the metrics backend. Its peers POST snapshots directly to the dashboard (/api/cluster/snapshot), so you get a cluster view in the embedded UI regardless of which micrometer-registry-* you use (or even with none). The only registry the dashboard itself reads back is Prometheus. There is no MetricsSource for OTLP/Elastic/Datadog/etc. — for those, either read the cluster picture in that vendor's UI, or run shared-store alongside.
Examples:
- Prometheus everywhere: apps export
micrometer-registry-prometheus; dashboardcluster.mode=prometheus. One pairing, full cluster view + p95/p99 in the embedded UI. - OTLP to Datadog, but still want the embedded dashboard clustered: apps export
micrometer-registry-otlpand setcluster.snapshot.publish-url; dashboardcluster.mode=shared-store. Datadog gets the meters; the dashboard gets snapshots — two parallel paths. - OTLP to your APM, no embedded cluster view needed: dashboard left at
local(or not deployed) — use the APM's dashboards.
Distributed Deployment: Scenarios¶
The dashboard reads the failover.* meters; cluster.mode chooses where it reads them from. Everything else (UI, KPIs, health, security) is identical across modes. The scenarios below are complete, copy-pasteable configs for each.
| Mode | Reads from | Infra | When |
|---|---|---|---|
local (default) | this instance's in-process registry | none | single JVM, dev |
shared-store | peers push snapshots → in-memory or JDBC | none, or a small DB table | small cluster (≤ ~10), no Prometheus |
prometheus | Prometheus HTTP API across all instances | Prometheus/TSDB | large cluster |
Each scenario below is a complete, copy-pasteable example.
Scenario A — Single JVM (default)¶
Nothing to configure beyond enabling the dashboard; cluster.mode defaults to local.
failover:
  dashboard:
    enabled: true            # secure-by-default: off unless set
Open http://<app>:<port>/failover-dashboard. Behind a load balancer this shows only the node that answered (a "this instance only" badge makes that explicit) — use one of the cluster modes below for a true aggregate.
Scenario B — Cluster via Prometheus (large clusters)¶
Each instance exposes /actuator/prometheus; Prometheus scrapes them; the dashboard aggregates with PromQL (sum, rate, histogram_quantile → cluster-wide p95/p99). Falls back to local if Prometheus is unreachable, so it never goes dark.
management:
  endpoints.web.exposure.include: prometheus,health
failover:
  dashboard:
    enabled: true
    cluster:
      mode: prometheus
      prometheus:
        base-url: http://prometheus:9090
        # token: <bearer>      # optional
        # timeout-seconds: 5
scrape_configs:
  - job_name: my-service
    metrics_path: /actuator/prometheus
    static_configs:
      - targets: ['app-1:8080', 'app-2:8080', 'app-3:8080']
Prometheus adds the instance label at scrape time, so the dashboard's per-instance grouping works automatically — you do not need the failover.observable.instance tag here (that tag is for push backends; see Observability). The Instances tab then breaks the cluster down per node (sum by (name, instance)).
Scenario C — Cluster via shared-store, in-memory (small clusters, no Prometheus)¶
Each instance pushes its local KPI snapshot to the dashboard; the dashboard aggregates them in memory with the same KPI math. Production-supported for ≤ ~10 instances. Consistency over durability: one (latest) snapshot per instance plus a reset-aware carried-forward baseline (totals never shrink on peer restart, ADR 67), stale peers flagged by a liveness window, reset-aware monotonic trend, age + size retention, and bounded instance retirement under pod churn.
failover:
  dashboard:
    enabled: true
    cluster:
      mode: shared-store
      shared-store:
        store: inmemory          # default
        max-instances: 10        # supported ceiling (warning beyond)
        instance-retention: 7d   # retire unseen instances (counts stay in the aggregate; 0 = never)
        sample-interval-seconds: 30   # cluster trend sampling cadence
        retention:
          max-age: 7d            # trend history age bound
          max-entries: 100000    # trend history size bound (oldest truncated)
failover:
  dashboard:
    enabled: true
    cluster:
      snapshot:
        publish-url: http://dashboard-host:8080/failover-dashboard
        interval-seconds: 15
The push endpoint sits behind the dashboard's access gate, so peers authenticate with the configured role (basic auth) — see Security below. Lost on dashboard restart (it's in memory); use Scenario D for restart-survival.
Each pushed snapshot is retained per instance, so the Instances tab lists every reporting node; the Health tab shows the cluster roll-up. To classify instances as LIVE / DOWN based on a lightweight heartbeat rather than snapshot age, see Instance Live Tracking (2.8).
Scenario D — Cluster via shared-store, JDBC durable¶
Same as C, but snapshots — including each instance's reset-aware carried baseline (BASELINE_JSON, ADR 67) — persist to a database, so the aggregate and the restart-correction history survive a dashboard restart. Add the optional module and flip one property.
<dependency>
  <groupId>com.societegenerale.failover</groupId>
  <artifactId>failover-dashboard-snapshotstore-jdbc</artifactId>
</dependency>
failover:
  dashboard:
    enabled: true
    cluster:
      mode: shared-store
      shared-store:
        store: jdbc
        max-instances: 10
        jdbc:
          table-prefix: ""       # prepended to the base table name; "" ⇒ FAILOVER_DASHBOARD_SNAPSHOT
          auto-ddl: true         # create the table on startup if missing
Requires a DataSource in the dashboard app (the usual spring.datasource.*). Peers are configured exactly as in Scenario C (cluster.snapshot.publish-url).
Is multi-tenancy required for the snapshot store?
No. The snapshot store holds only aggregate, non-sensitive failover metrics (counts, rates, latency means/percentiles) — never business data, payloads, keys or PII. So the per-tenant data-isolation / compliance reasons that drive the failover store's multi-tenancy (failover.store.multitenant) do not apply here. One shared table is correct and simplest.
If you need to namespace the table — e.g. several environments or several independent dashboards sharing one database — use table-prefix (validated: letters/digits/underscore only). If you genuinely want per-tenant dashboards, run separate dashboard instances each with its own table-prefix (or its own schema); the snapshot store itself stays single-table and tenant-agnostic by design.
Table name. table-prefix + the base FAILOVER_DASHBOARD_SNAPSHOT (e.g. prefix DEMO_ → DEMO_FAILOVER_DASHBOARD_SNAPSHOT). The prefix is validated as a safe SQL identifier fragment (no injection).
DDL. With auto-ddl: true the table is created automatically. To manage the schema yourself (auto-ddl: false), create it with the dialect-appropriate type for the JSON column:
CREATE TABLE FAILOVER_DASHBOARD_SNAPSHOT (
    INSTANCE_ID   VARCHAR(255) PRIMARY KEY,
    RECEIVED_AT   BIGINT       NOT NULL,
    SUMMARY_JSON  TEXT         NOT NULL,         -- or JSONB
    BASELINE_JSON TEXT                           -- reset-aware carried baseline (ADR 67); nullable
);
CREATE TABLE FAILOVER_DASHBOARD_SNAPSHOT (
    INSTANCE_ID   VARCHAR(255) PRIMARY KEY,
    RECEIVED_AT   BIGINT       NOT NULL,
    SUMMARY_JSON  LONGTEXT     NOT NULL,
    BASELINE_JSON LONGTEXT
);
CREATE TABLE FAILOVER_DASHBOARD_SNAPSHOT (
    INSTANCE_ID   VARCHAR2(255) PRIMARY KEY,
    RECEIVED_AT   NUMBER(19)    NOT NULL,
    SUMMARY_JSON  CLOB          NOT NULL,
    BASELINE_JSON CLOB
);
CREATE TABLE IF NOT EXISTS FAILOVER_DASHBOARD_SNAPSHOT (
    INSTANCE_ID   VARCHAR(255) PRIMARY KEY,
    RECEIVED_AT   BIGINT       NOT NULL,
    SUMMARY_JSON  CLOB         NOT NULL,
    BASELINE_JSON CLOB
);
Prepend your table-prefix to the table name if you set one. One row per instance (upserted on each push). SUMMARY_JSON holds the latest raw snapshot; BASELINE_JSON (nullable) accumulates the pre-restart totals folded in when a counter reset is detected — the dashboard serves baseline + raw per instance. Every row contributes its last-known counts to the aggregate; the liveness window only drives the LIVE/DOWN status shown in the Instances tab.
Scenario E — Standalone dashboard (its own app)¶
Run the dashboard as its own small Spring Boot app pointed at a backend, so a cluster has one dashboard rather than one embedded per instance. The @Failover library is not on its classpath.
spring:
  application.name: failover-dashboard
failover:
  dashboard:
    enabled: true
    cluster:
      mode: prometheus          # or shared-store (then peers push to this app)
      prometheus:
        base-url: http://prometheus:9090
The app needs spring-boot-starter-web, spring-boot-starter-security, a MeterRegistry, and the failover-dashboard (or its starter) dependency. With no failover library there are no @Failover methods to discover, so the Config view is empty while all metrics/health/trend views work from the backend — a no-op FailoverScanner is supplied automatically. (For shared-store mode, also add failover-dashboard-snapshotstore-jdbc if you want durability.)
Configuration How-To¶
Complete, copy-pasteable YAML for every deployment shape. Each scenario shows two YAML blocks — one for the @Failover microservice (the app that uses @Failover methods) and one for the dashboard service (which may be the same process). Sub-scenarios 2.x cover the snapshot ingest authentication options.
1. Single JVM¶
All-in-one: the same process runs the @Failover methods and serves the dashboard. cluster.mode defaults to local (reads the in-process MeterRegistry); no cluster config is needed.
┌────────────────────────────────────────────────────┐
│  Single JVM                                        │
│                                                    │
│  ┌─────────────────┐    ┌──────────────────────┐   │
│  │ @Failover beans │───►│  MeterRegistry       │   │
│  └─────────────────┘    └──────────┬───────────┘   │
│                                    │               │
│                          ┌─────────▼────────────┐  │
│                          │  Dashboard (local)   │  │
│                          │  /failover-dashboard │  │
│                          └──────────────────────┘  │
└────────────────────────────────────────────────────┘
1.1 Minimal — Basic Enable¶
failover:
  dashboard:
    enabled: true    # everything else defaults; store = whatever failover.store.type is set to
With no security.allow-insecure, the dashboard requires Spring Security (bundled by the starter). Grant the FAILOVER_ADMIN role to your admin user or override the filter chain.
1.2 With InMemory Failover Store (Dev / Test)¶
No extra deps; store is cleared on restart.
1.3 With Caffeine Store (Single-Node Cache)¶
1.4 With JDBC Failover Store (Production)¶
Persistence across restarts; shared by all methods in this JVM.
spring:
  datasource:
    url: jdbc:postgresql://db:5432/myapp
    username: myapp
    password: secret

failover:
  store:
    type: jdbc
  dashboard:
    enabled: true
1.5 With Trend History (Reload-Surviving Charts)¶
Enables the server-side ring buffer; trend charts survive a browser reload.
failover:
  dashboard:
    enabled: true
    history:
      enabled: true
      samples: 120
      sample-interval-seconds: 15   # retains ~30 min with these defaults
1.6 With Prometheus Registry¶
failover.* meters flow to Prometheus. The dashboard still reads local (in-process registry) — use cluster.mode=prometheus only when the dashboard needs to aggregate meters across multiple instances.
management:
  endpoints:
    web:
      exposure:
        include: prometheus,health

failover:
  dashboard:
    enabled: true
1.7 With OTLP / Elastic / Datadog Registry¶
Same as 1.6: add the Micrometer registry to export meters to your APM; the dashboard reads local. For push registries, auto-tagging adds an instance identity (useful when you later scale out).
management:
  otlp:
    metrics:
      export:
        url: http://otel-collector:4318/v1/metrics
        enabled: true

failover:
  observable:
    instance:
      mode: auto                  # auto-tags push registries; skips Prometheus
      id: ${HOSTNAME:my-service}  # readable stable id on k8s/Docker
  dashboard:
    enabled: true
2. Cluster / Distributed¶
Multiple JVMs emit failover.* metrics; the dashboard must aggregate them. Choose a mode:
Is Prometheus already in the infra?
   Yes → cluster.mode=prometheus (large clusters, p95/p99 available)
   No  → cluster.mode=shared-store (small clusters ≤ ~10, no extra infra)

For shared-store — does the aggregate need to survive a dashboard restart?
   Yes → store=jdbc (durable)
   No  → store=inmemory (simple)
In cluster mode the dashboard host aggregates metrics from all peers (the @Failover services). They may be the same process (each instance runs the dashboard and pushes to the others) or a dedicated standalone app (see scenario 2.7).
The POST endpoint that receives peer snapshots is /api/cluster/snapshot; it can be secured with Basic Auth, OAuth2 Bearer, or left open (dev only). See the authentication summary below.
2.1 In-Memory Shared-Store — Open Ingest (Dev / Trusted Network)¶
Simplest cluster setup. No auth on the ingest endpoint; peers push without credentials.
  @Failover Service 1          @Failover Service 2
 ┌───────────────────┐         ┌───────────────────┐
 │ @Failover beans   │         │ @Failover beans   │
 │ MeterRegistry     │         │ MeterRegistry     │
 │ SnapshotPublisher │         │ SnapshotPublisher │
 └────────┬──────────┘         └────────┬──────────┘
          │ POST /api/cluster/snapshot  │
          │ (no credentials)            │
          └────────────┬────────────────┘
                       ▼
          ┌─────────────────────────────┐
          │  Dashboard Host             │
          │  SnapshotStore (inmemory)   │
          │  SharedStoreMetricsSource   │
          │  /failover-dashboard        │
          └─────────────────────────────┘
@Failover service YAML (every peer):
failover:
  dashboard:
    enabled: true
    cluster:
      snapshot:
        publish-url: http://dashboard-host:8080/failover-dashboard
        interval-seconds: 15
        allow-insecure-ingest: true   # suppresses the publisher-side no-auth startup WARN
        # no username / password / oauth2 (matches open ingest on dashboard)
Dashboard host YAML:
failover:
  dashboard:
    enabled: true
    cluster:
      mode: shared-store
      shared-store:
        store: inmemory
        max-instances: 10
      snapshot:
        allow-insecure-ingest: true   # ⚠ dev / trusted-network only — logs startup WARN
                                      # refused under the 'prod' profile
Open ingest
allow-insecure-ingest: true creates a permit-all POST endpoint. Use only on a trusted internal network or in development. Refused under the prod Spring profile.
2.2 In-Memory Shared-Store — Basic Auth (Production, No IdP)¶
Adds HTTP Basic Auth to the ingest endpoint. Password is plain text on both sides (the dashboard applies {noop} internally; the publisher sends it as-is in the Authorization: Basic header).
  @Failover Service(s)
 ┌──────────────────────────────────┐
 │  MeterRegistry                   │
 │  SnapshotPublisher               │──► POST /api/cluster/snapshot
 │  (Authorization: Basic user:pwd) │    Authorization: Basic base64(u:p)
 └──────────────────────────────────┘
                  │
                  ▼
 ┌────────────────────────────────────────┐
 │  Dashboard Host                        │
 │  dashboardIngestBasicFilterChain       │── validates username + {noop}password
 │  SnapshotStore (inmemory)              │
 │  /failover-dashboard                   │
 └────────────────────────────────────────┘
@Failover service YAML (every peer):
failover:
  dashboard:
    enabled: true
    cluster:
      snapshot:
        publish-url: http://dashboard-host:8080/failover-dashboard
        interval-seconds: 15
        username: ingest-user   # must match dashboard's snapshot.username
        password: s3cr3t        # plain text — sent as HTTP Basic
Dashboard host YAML:
failover:
  dashboard:
    enabled: true
    cluster:
      mode: shared-store
      shared-store:
        store: inmemory
        max-instances: 10
      snapshot:
        username: ingest-user   # creates dashboardIngestBasicFilterChain
        password: s3cr3t        # plain text — {noop} applied internally
Password must be plain text
Do not use Spring Security encoded strings ({bcrypt}…) as the password. The publisher sends the value as-is in the Authorization: Basic header; a {bcrypt} hash would be sent literally and never match.
2.3 In-Memory Shared-Store — OAuth2 Bearer (Production, Existing IdP)¶
Uses the consumer's existing OAuth2AuthorizedClientManager; no new dependencies when the app already has spring-security-oauth2-client. The dashboard validates the Bearer token via JWT (spring-security-oauth2-resource-server). Tokens rotate automatically — no shared secret to manage.
  @Failover Service(s)          Identity Provider (IdP)
 ┌────────────────────────┐     ┌─────────────────────┐
 │  OAuth2Authorized      │────►│  /token (client_    │
 │  ClientManager         │◄────│   credentials flow) │
 │  SnapshotPublisher     │     └─────────────────────┘
 │  Bearer: <jwt>         │
 └──────────┬─────────────┘
            │ POST /api/cluster/snapshot
            │ Authorization: Bearer <jwt>
            ▼
 ┌─────────────────────────────────────────┐
 │  Dashboard Host                         │
 │  dashboardIngestOAuth2FilterChain       │── JWT validation (issuer-uri)
 │  SnapshotStore (inmemory)               │
 │  /failover-dashboard                    │
 └─────────────────────────────────────────┘
@Failover service YAML (every peer):
spring:
  security:
    oauth2:
      client:
        registration:
          failover-dashboard:                  # registration id (your choice)
            provider: my-idp
            client-id: failover-peer
            client-secret: <secret>
            authorization-grant-type: client_credentials
            scope: failover:ingest
        provider:
          my-idp:
            token-uri: https://idp.example.com/realms/myrealm/protocol/openid-connect/token

failover:
  dashboard:
    enabled: true
    cluster:
      snapshot:
        publish-url: http://dashboard-host:8080/failover-dashboard
        interval-seconds: 15
        oauth2-client-registration-id: failover-dashboard   # matches the registration above
Add to peer-service/pom.xml:
<dependency>
  <groupId>org.springframework.security</groupId>
  <artifactId>spring-security-oauth2-client</artifactId>
</dependency>
Dashboard host YAML:
spring:
  security:
    oauth2:
      resourceserver:
        jwt:
          issuer-uri: https://idp.example.com/realms/myrealm

failover:
  dashboard:
    enabled: true
    cluster:
      mode: shared-store
      shared-store:
        store: inmemory
        max-instances: 10
      # no snapshot.username needed — OAuth2 chain activates from the classpath dep below
Add to dashboard-host/pom.xml:
<dependency>
  <groupId>org.springframework.security</groupId>
  <artifactId>spring-security-oauth2-resource-server</artifactId>
</dependency>
<dependency>
  <groupId>org.springframework.security</groupId>
  <artifactId>spring-security-oauth2-jose</artifactId>
</dependency>
Auth priority on the publisher
When oauth2-client-registration-id is set and OAuth2AuthorizedClientManager is in the Spring context, OAuth2 Bearer takes priority over Basic Auth (even if username/password are also set). If the OAuth2AuthorizedClientManager bean is absent, the publisher falls back to Basic Auth.
2.4 JDBC Shared-Store — Basic Auth (Durable, Production)¶
Same as 2.2 but snapshots persist to a database; the cluster aggregate survives a dashboard restart.
  @Failover Service(s)
 ┌───────────────────────────┐
 │  SnapshotPublisher        │──► POST /api/cluster/snapshot
 │  (Authorization: Basic)   │    Authorization: Basic base64(u:p)
 └───────────────────────────┘
                 │
                 ▼
 ┌──────────────────────────────────────────┐
 │  Dashboard Host                          │
 │  dashboardIngestBasicFilterChain         │
 │  SnapshotStore (JDBC)                    │──► FAILOVER_DASHBOARD_SNAPSHOT table
 │  /failover-dashboard                     │
 └──────────────────────────────────────────┘
                 │
                 ▼
 ┌──────────────────────────┐
 │  Database                │
 │  (PostgreSQL / MySQL /   │
 │   MariaDB / Oracle / H2) │
 └──────────────────────────┘
@Failover service YAML: identical to scenario 2.2 (just publish-url + username + password).
Dashboard host YAML:
spring:
  datasource:
    url: jdbc:postgresql://db:5432/dashboard
    username: dashboard
    password: secret

failover:
  dashboard:
    enabled: true
    cluster:
      mode: shared-store
      shared-store:
        store: jdbc
        max-instances: 10
        jdbc:
          table-prefix: ""    # "" → FAILOVER_DASHBOARD_SNAPSHOT
          auto-ddl: true      # create the table on startup; set false to manage DDL yourself
      snapshot:
        username: ingest-user
        password: s3cr3t
Add to dashboard-host/pom.xml:
<dependency>
  <groupId>com.societegenerale.failover</groupId>
  <artifactId>failover-dashboard-snapshotstore-jdbc</artifactId>
</dependency>
2.5 JDBC Shared-Store — OAuth2 Bearer (Durable, Production, Existing IdP)¶
Combine JDBC durability (2.4) with OAuth2 auth (2.3).
@Failover service YAML: identical to scenario 2.3 (OAuth2 client credentials + oauth2-client-registration-id).
Dashboard host YAML:
spring:
  datasource:
    url: jdbc:postgresql://db:5432/dashboard
    username: dashboard
    password: secret
  security:
    oauth2:
      resourceserver:
        jwt:
          issuer-uri: https://idp.example.com/realms/myrealm

failover:
  dashboard:
    enabled: true
    cluster:
      mode: shared-store
      shared-store:
        store: jdbc
        max-instances: 10
        jdbc:
          table-prefix: ""
          auto-ddl: true
Dependencies: failover-dashboard-snapshotstore-jdbc + spring-security-oauth2-resource-server + spring-security-oauth2-jose.
2.6 Prometheus Mode (Large Clusters, Prometheus in Infra)¶
No snapshot push from peers. Prometheus scrapes every instance; the dashboard aggregates with PromQL. Per-instance view and p95/p99 latency are available. Falls back to local if Prometheus is unreachable.
  @Failover Service 1       @Failover Service 2      @Failover Service 3
 ┌──────────────────┐      ┌──────────────────┐      ┌──────────────────┐
 │ @Failover beans  │      │ @Failover beans  │      │ @Failover beans  │
 │ MeterRegistry    │      │ MeterRegistry    │      │ MeterRegistry    │
 │ /actuator/       │      │ /actuator/       │      │ /actuator/       │
 │  prometheus      │      │  prometheus      │      │  prometheus      │
 └────────┬─────────┘      └────────┬─────────┘      └────────┬─────────┘
          │ scrape                  │ scrape                   │ scrape
          └────────────────┬────────┘──────────────────────────┘
                           ▼
                ┌─────────────────────┐
                │  Prometheus         │
                └──────────┬──────────┘
                           │ PromQL (sum / rate / histogram_quantile)
                           ▼
                ┌──────────────────────────┐
                │  Dashboard Host          │
                │  PrometheusMetricsSource │
                │  /failover-dashboard     │
                └──────────────────────────┘
@Failover service YAML (every instance) — no cluster.snapshot needed:
management:
  endpoints:
    web:
      exposure:
        include: prometheus,health

# failover config as normal — no dashboard cluster settings required on peers
Dashboard host YAML:
failover:
  dashboard:
    enabled: true
    cluster:
      mode: prometheus
      prometheus:
        base-url: http://prometheus:9090
        # token: <bearer>          # optional, when Prometheus is secured
        # timeout-seconds: 5
Prometheus scrape config:
scrape_configs:
  - job_name: my-failover-service
    metrics_path: /actuator/prometheus
    static_configs:
      - targets:
          - app-1:8080
          - app-2:8080
          - app-3:8080
No snapshot.publish-url on peers
In prometheus mode peers do not configure cluster.snapshot.publish-url. The dashboard reads directly from Prometheus via PromQL; peers only need to expose /actuator/prometheus.
Per-instance label in the Instances tab
Prometheus adds the instance label at scrape time; the dashboard's Instances tab groups by it automatically. You do not need failover.observable.instance.* here — that property tags push registries (OTLP, Elastic, Datadog) which Prometheus doesn't use.
2.7 Standalone Dashboard (Dedicated App, No @Failover on Dashboard Classpath)¶
The dashboard runs as its own Spring Boot app; @Failover services push snapshots to it. The failover-spring-boot-starter is not required in the dashboard app; a no-op FailoverScanner is provided automatically (Config view is empty — no @Failover methods to discover).
  @Failover Service 1      @Failover Service 2
 ┌──────────────────┐      ┌──────────────────┐
 │ @Failover beans  │      │ @Failover beans  │
 │ SnapshotPublisher│      │ SnapshotPublisher│
 └────────┬─────────┘      └────────┬─────────┘
          │ POST /api/cluster/snapshot
          └──────────────┬───────────────────
                         ▼
          ┌──────────────────────────────────────┐
          │  Standalone Dashboard App            │
          │  (no failover library required)      │
          │  Config view: empty (no @Failover)   │
          │  Metrics / Health / Instances: live  │
          │  /failover-dashboard                 │
          └──────────────────────────────────────┘
Standalone dashboard YAML:
spring:
  application.name: failover-dashboard
  # datasource only needed when store=jdbc:
  datasource:
    url: jdbc:postgresql://db:5432/dashboard
    username: dashboard
    password: secret

failover:
  dashboard:
    enabled: true
    cluster:
      mode: shared-store        # or prometheus
      shared-store:
        store: inmemory         # or jdbc (add failover-dashboard-snapshotstore-jdbc)
      snapshot:
        username: ingest-user   # or use oauth2, or allow-insecure-ingest for dev
        password: s3cr3t
@Failover service YAML (same as scenario 2.2):
failover:
  dashboard:
    enabled: true
    cluster:
      snapshot:
        publish-url: http://dashboard-app:8080/failover-dashboard
        interval-seconds: 15
        username: ingest-user
        password: s3cr3t
2.8 Instance Live Tracking (Heartbeat)¶
By default the dashboard knows an instance pushed a snapshot but does not actively track whether that instance is still running. If a service crashes after its last snapshot push, the dashboard has no way to distinguish "still alive but idle" from "crashed" — both look the same.
Instance live tracking adds a dedicated lightweight heartbeat: each peer sends {"instanceId":"..."} to the dashboard on a short fixed interval (no metrics payload, ~10 bytes). The dashboard records the receive time and classifies instances as LIVE or DOWN. The dot colour in the Instances tab changes accordingly, and the topbar shows instance live tracking · on. When disabled, the dot reflects snapshot age only and the topbar shows instance live tracking · off.
Key design decisions:
- Off by default — zero overhead unless you opt in on both sides.
- Metrics of DOWN instances are preserved — last-known values still contribute to the cluster aggregate. Only the dot turns red; the numbers are not zeroed.
- Liveness ≠ snapshot freshness — a healthy instance with no upstream calls (quiet period) keeps its heartbeat green even if no snapshots arrive.
- Heartbeat URL is auto-derived —
/api/cluster/snapshot→/api/cluster/heartbeat; override only for non-standard paths.
Recommended timing rule: set liveness-seconds ≥ 3 × heartbeat.interval-seconds so an instance must miss three pings before it is classified as DOWN.
  @Failover Service                    Dashboard Host
 ┌─────────────────────────────────┐   ┌──────────────────────────────────┐
 │  ClusterSnapshotPublisher       │──►│  POST /api/cluster/snapshot      │
 │  (every 15s, event-driven)      │   │  → SnapshotStore                 │
 │                                 │   │                                  │
 │  HeartbeatPublisher             │──►│  POST /api/cluster/heartbeat     │
 │  (every 60s, fixed schedule)    │   │  → HeartbeatStore                │
 └─────────────────────────────────┘   │                                  │
                                       │  instances() enriched with       │
                                       │  LIVE / DOWN from heartbeat age  │
                                       └──────────────────────────────────┘
Step 1 — Enable heartbeat on each @Failover service peer:
failover:
  dashboard:
    enabled: true
    cluster:
      snapshot:
        publish-url: http://dashboard-host:8080/failover-dashboard
        interval-seconds: 15
        username: ingest-user   # same auth as snapshot push
        password: s3cr3t
        heartbeat:
          enabled: true           # off by default — opt in explicitly
          interval-seconds: 60    # ping cadence (default); keep well below liveness-seconds on dashboard
The heartbeat uses the same auth as the snapshot endpoint (Basic Auth or OAuth2 — whichever is configured). The heartbeat URL is always derived as {publish-url}/api/cluster/heartbeat.
Step 2 — Enable liveness tracking on the dashboard:
failover:
  dashboard:
    enabled: true
    cluster:
      mode: shared-store
      shared-store:
        store: inmemory
        liveness-seconds: 180    # heartbeat age threshold: DOWN after 180s without a ping (= 3 × peer interval-seconds of 60s)
      snapshot:
        username: ingest-user
        password: s3cr3t
Sizing the liveness window
Set liveness-seconds = 3 × peer heartbeat.interval-seconds. With heartbeat.interval-seconds: 60 (default), use liveness-seconds: 180 — an instance must miss three consecutive pings before it flips to DOWN, tolerating transient hiccups without false positives. Do not use liveness-seconds ≤ heartbeat.interval-seconds; the instance would be marked DOWN before its first ping arrives.
What you see in the UI:
| Instance state | Dot colour | Topbar badge |
|---|---|---|
| Tracking disabled | light green (unknown) | instance live tracking · off |
| Tracking on, heartbeat fresh | green pulse | instance live tracking · on |
| Tracking on, heartbeat expired | red | instance live tracking · on |
Heartbeat endpoint security
POST /api/cluster/heartbeat is gated by the same filter chain as POST /api/cluster/snapshot. No extra security config is needed; peers authenticate identically to snapshot pushes.
Snapshot Ingest Authentication: Options¶
The POST /api/cluster/snapshot endpoint receives peer metric snapshots. It can be secured three ways. Choose one; the dashboard activates the matching filter chain automatically.
Option 1 — HTTP Basic Auth¶
When to use: peers can't use OAuth2; a shared secret is acceptable; no IdP in the infra.
Peer                                  Dashboard
 │──► POST /api/cluster/snapshot           │
 │    Authorization: Basic base64(u:p)     │
 │                              dashboardIngestBasicFilterChain
 │                                         │── InMemoryUserDetailsManager({noop}pwd)
 │                                         │── 401 if credentials mismatch
 │◄── 200 OK ──────────────────────────────│
Dashboard properties:
failover:
  dashboard:
    cluster:
      snapshot:
        username: ingest-user   # activates dashboardIngestBasicFilterChain
        password: s3cr3t        # plain text — {noop} applied internally on the dashboard
Peer properties:
failover:
  dashboard:
    cluster:
      snapshot:
        publish-url: http://dashboard:8080/failover-dashboard
        username: ingest-user   # must match dashboard's snapshot.username
        password: s3cr3t        # plain text — sent as-is in Authorization: Basic
Option 2 — OAuth2 Bearer (Recommended when IdP is available)¶
When to use: peers already have OAuth2AuthorizedClientManager; IdP manages tokens; no shared secrets; automatic token rotation.
Peer                  IdP                     Dashboard
 │──► POST /token ───►│                           │
 │◄── Bearer JWT ─────│                           │
 │──► POST /api/cluster/snapshot ────────────────►│
 │    Authorization: Bearer <jwt>    dashboardIngestOAuth2FilterChain
 │                                               │── jwt().issuerUri validation
 │                                               │── 401 if token invalid / expired
 │◄── 200 OK ────────────────────────────────────│
Dashboard properties:
spring:
  security:
    oauth2:
      resourceserver:
        jwt:
          issuer-uri: https://idp.example.com/realms/myrealm
# No snapshot.username needed — OAuth2 chain activates via classpath dep
Dashboard pom.xml additions: spring-security-oauth2-resource-server + spring-security-oauth2-jose.
Peer properties:
spring:
  security:
    oauth2:
      client:
        registration:
          failover-dashboard:
            client-id: failover-peer
            client-secret: <secret>
            authorization-grant-type: client_credentials
            scope: failover:ingest
        provider:
          my-idp:
            token-uri: https://idp.example.com/realms/myrealm/protocol/openid-connect/token

failover:
  dashboard:
    cluster:
      snapshot:
        publish-url: http://dashboard:8080/failover-dashboard
        oauth2-client-registration-id: failover-dashboard
Peer pom.xml addition: spring-security-oauth2-client.
Option 3 — No Auth / Open Ingest (Dev / Trusted Networks Only)¶
When to use: development, or peers and dashboard share an isolated, trusted network. Never production without network controls.
Dashboard properties:
failover:
  dashboard:
    cluster:
      snapshot:
        allow-insecure-ingest: true   # ⚠ logs WARN at startup; refused under 'prod' profile
Peer properties:
failover:
  dashboard:
    cluster:
      snapshot:
        publish-url: http://dashboard:8080/failover-dashboard
        allow-insecure-ingest: true   # suppresses the publisher-side no-auth startup WARN
        # no username / password / oauth2 needed
Without allow-insecure-ingest: true on the peer, the publisher logs a startup WARN on every peer that no auth is configured — even when the open ingest is intentional. Set this flag to acknowledge the insecure choice and silence the warn.
Auth Priority Summary¶
| Priority | Active when | Filter chain (dashboard) | Publisher sends |
|---|---|---|---|
| 1 — OAuth2 Bearer | spring-security-oauth2-resource-server on dashboard classpath | dashboardIngestOAuth2FilterChain @Order(-10) | Authorization: Bearer <jwt> |
| 2 — Basic Auth | snapshot.username set on dashboard; OAuth2 chain absent | dashboardIngestBasicFilterChain @Order(-10) | Authorization: Basic base64(u:p) |
| 3 — Open | snapshot.allow-insecure-ingest: true on dashboard; both above absent | dashboardIngestOpenFilterChain @Order(-10) (permit-all + WARN) | (none) — set allow-insecure-ingest: true on peer too to suppress the publisher-side WARN |
OAuth2 always wins when both OAuth2 and Basic are configured. The dashboard's main UI/API filter chain (dashboardSecurityFilterChain) operates at @Order(0) and is not affected by the ingest chain.
Exporting Metrics Elsewhere (OTLP / Elastic)¶
The dashboard reads failover.* meters; how those meters leave each instance is a plain Micrometer concern — no failover module is required. Add the matching Micrometer registry to the application and the failover.* meters flow with everything else:
- OTLP (vendor-neutral → Prometheus / Elastic / Datadog / …): add
micrometer-registry-otlp. - Elastic: add
micrometer-registry-elastic.
For these push backends, per-instance attribution is automatic: failover.observable.instance.mode defaults to auto, which tags push registries (and skips Prometheus). Set failover.observable.instance.id=${HOSTNAME} on k8s/Docker for a readable identity. See Observability.
For a metrics read source over Elasticsearch (or a log drill-down view), implement the MetricsSource SPI in an optional failover-dashboard-source-elastic module gated by @ConditionalOnClass/@ConditionalOnProperty — the same extension pattern as the Prometheus and shared-store sources.
Next Steps¶
- Observability — the meters the dashboard consumes
- Properties Reference —
failover.dashboard.* - Security — data-minimisation and the access gate